




US Dollar Index Climbs for 10th Day as Inflation Data Undermines Fed Cuts
US dollar rallies for a 10th straight day after hotter CPI data weakens the case for Fed rate cuts and triggers broad strength against major currencies.
Share this:
The US dollar index (DXY) posted its 10th consecutive daily gain on Tuesday—its longest rally of the year—after hotter-than-expected June CPI data reduced the probability of a September Fed rate cut. Although core inflation rose slightly less than expected at 2.9% y/y, it remains well above the Fed’s 2% target, and markets quickly adjusted. Fed Funds futures now price in just a 53.5% chance of a cut in September, down from 59.3% the day before. As the dollar strengthened across the board, JPY, EUR, GBP, and AUD all came under renewed pressure.
View related analysis:
View related analysis:
USD Rally Extends to 10 Days as CPI Print Dampens Fed Rate Cut Bets
The US dollar index rose for a tenth consecutive day on Tuesday, after June’s hotter inflation figures leaves less wriggle room for the Fed to cut rates. While core CPI didn’t quite rise as much as expected, its 2.9% y/y print won’t inspire the Fed to signal the September cut markets have been pricing in. The probability of a Fed September cut has fallen to 53.5% from 59.3% the day prior.
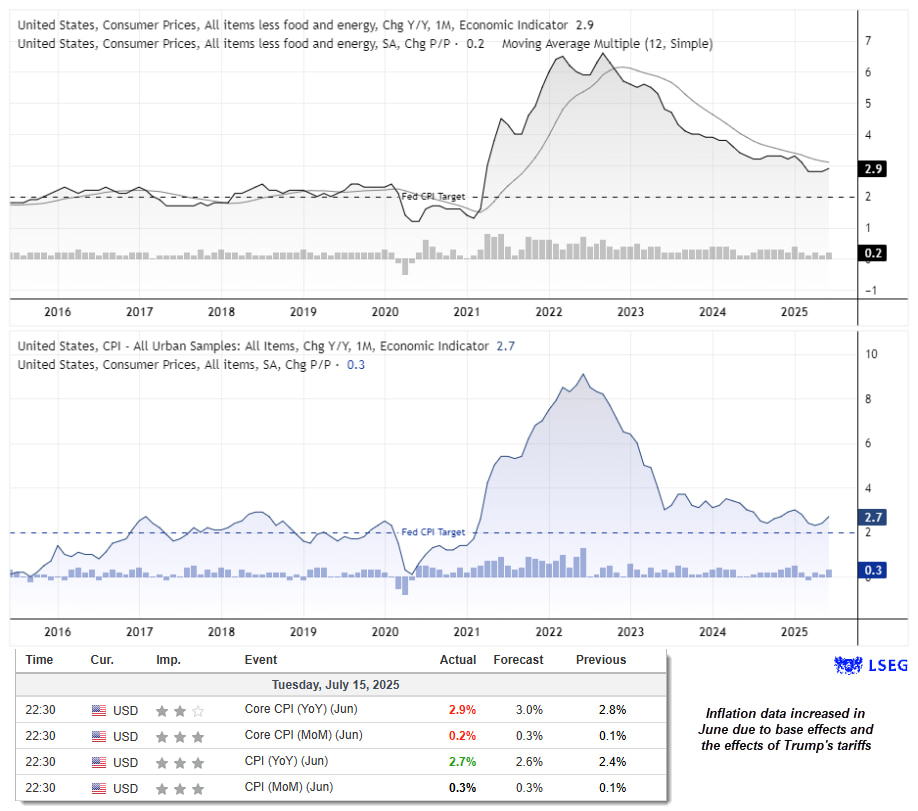
Chart prepared by Matt Simpson, data source: Bureau of Labor Statistics (LBS), London Stock Exchange Group (LSEG)
• US core CPI rose to 2.9% y/y (3% expected), or 0.9 percentage points above the Fed’s inflation target
• Core CPI rose 0.2% m/m in June compared to 0.3% expected
• CPI rose 2.7% y/y (2.6% expected) and 0.3% m/m as expected
This has likely sparked mixed emptions for Fed chair Jerome Powell, who was right to warn of higher consumer prices in the summer months, knowing full well that it would lead to further attacks from President Trump who is failing to strongarm him into cutting rates.
US Treasury Secretary Scott Bessent has suggested Powell step down from the board in May, presumably so Trump can install a dovish minion.
US Dollar Index (DXY) Technical Analysis
The dollar’s 10-day rally marks its strongest bullish run on the daily chart since October—and only the second such streak in six years. We’d have to look back to two instances in 2017 and one in 2012 to find stronger rallies, which statistically suggests the current run may be due for a pause.
That said, none of those prior rallies marked major turning points lower; in fact, the US dollar continued to strengthen in the following weeks or months.
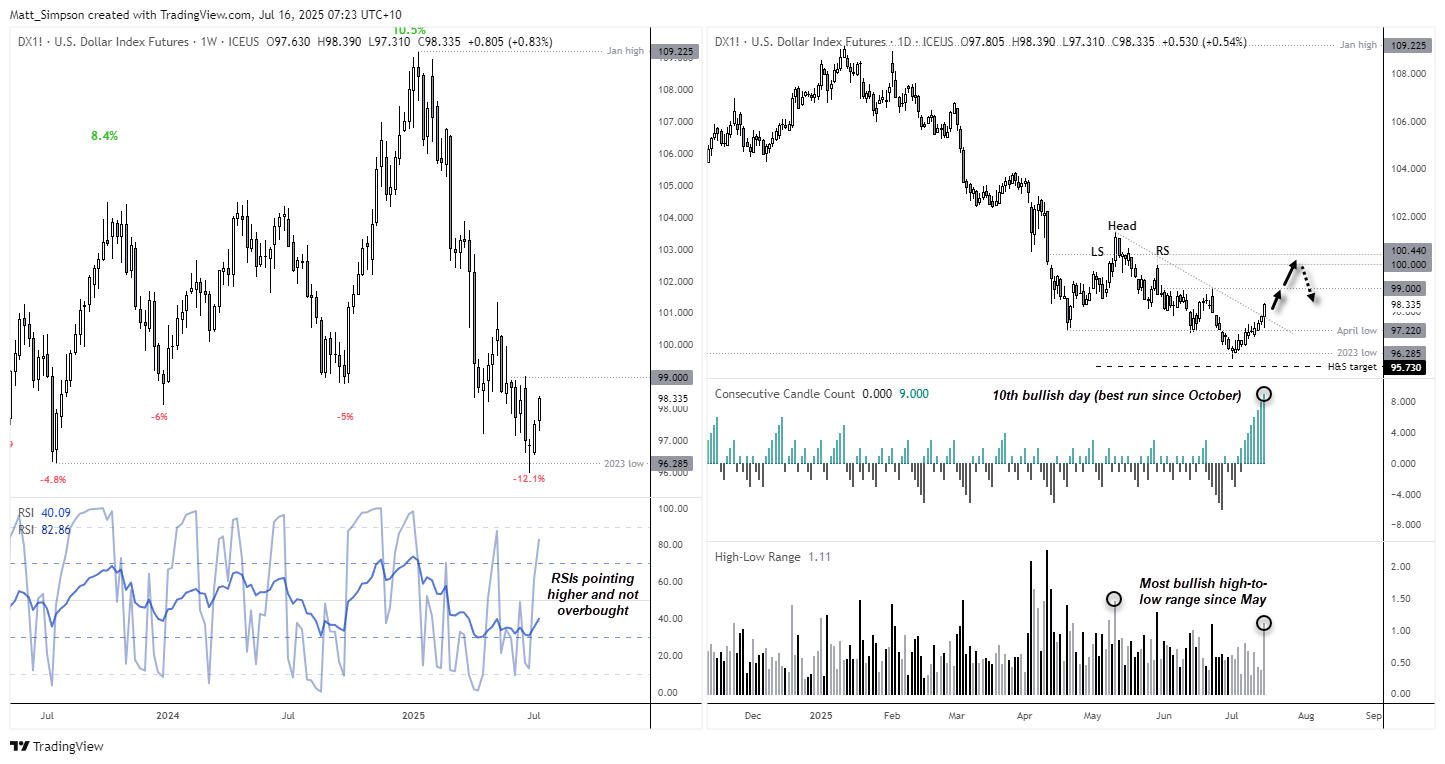
Chart analysis by Matt Simpson - data source: TradingView U.S. Dollar Index Futures
Bullish momentum on the USD index (DXY) is clearly building. Tuesday’s 1.1% high-to-low range was its most bullish since May and its most volatile session in 17 days. Importantly, DXY closed firmly above trendline resistance, and its daily low held above the April low—suggesting continued demand at that level. A move to 99 now seems likely, and if that level breaks, the 100 handle comes into view.
Bearish USD Positioning Near Extreme as Short Covering Fuels USD Index Rally
As mentioned in my recent COT reports, USD positioning remains stretched on the bearish side, with asset managers still near record net-short exposure. Gross-shorts are also near a sentiment extreme and longs remain historically low among asset managers. Every tick higher causes pain for bears and could continue to trigger short covering, adding fuel to the rally.
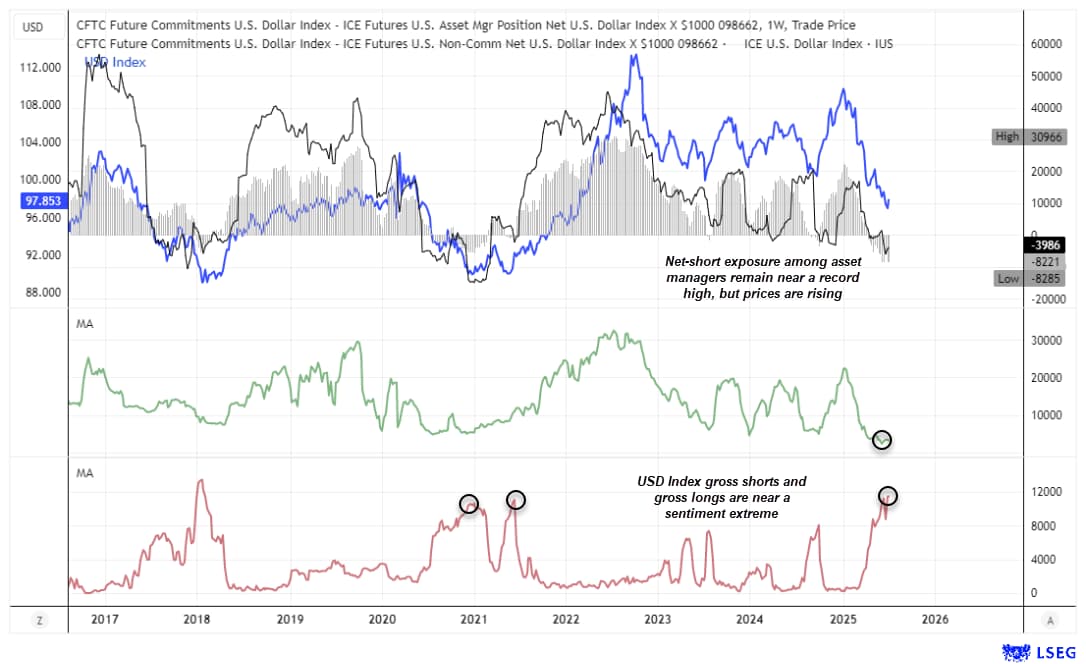
Chart prepared by Matt Simpson, data source: CME, London Stock Exchange Group (LSEG)
US Dollar Surges as Yen Slides, GBP and AUD Weaken Against Broad USD Strength
• The Japanese yen (JPY) was the weakest major currency on Tuesday, falling against all its FX peers.
• The US dollar was the strongest performer, with USD/JPY rising 0.8% to a 3.5-month high. A break above the 149 handle now brings 150 into focus.
• The Australian dollar (AUD) delivered a mixed performance—AUD/JPY rose 0.26%, but AUD/USD fell for a third straight session (-0.5%). GBP/AUD also formed a bullish outside day at key support.
• EUR/USD declined for a fourth consecutive day and is threatening a break below the 1.16 handle.
• GBP/USD extended its losing streak to eight days, pressured by renewed expectations of BOE rate cuts and broader USD strength. It now sits just above its June low.
• The Dow Jones led Wall Street indices lower, forming a bearish engulfing candle and approaching its 20-day EMA support.
• SPI 200 futures erased Tuesday’s daytime gains overnight, pointing to a weak open for the ASX 200 cash index.

View the full economic calendar
View the full economic calendar
-- Written by Matt Simpson
Follow Matt on Twitter @cLeverEdge
How to trade with City Index
You can trade with City Index by following these four easy steps:
- Open an account, or log in if you’re already a customer
• Open an account in the UK
• Open an account in Australia
• Open an account in Singapore
- Search for the market you want to trade in our award-winning platform
- Choose your position and size, and your stop and limit levels
- Place the trade
Related tags:
Latest market news




The complete CFD trading experience
Award-winning platforms, competitive spreads, low commissions and dedicated support.
We live and breathe the markets and are dedicated to helping traders realise their ambitions as we continue to set the industry bar.
Economic calendar
Web Trader platform
Our sophisticated web-based platform is packed with features.
Related articles
Swiss Franc Forecast: USD/CHF Seven-Week Rally Reverses From Yearly Highs 10 16 2026
A sharp rejection from fresh highs has shifted momentum in favor of USD/CHF bears, raising the stakes for a critical support test.

Nasdaq 100 forecast: Tech stocks not out of woods yet
US index futures pushed higher in the first half of Friday’s session, taking cues from a strong performance from European equities. Both European and US equity futures extending yesterday’s impressive recovery after the sharp sell-off earlier in the week. But the lingering concerns around the AI investment cycle remain, while bond markets were easing lower again, lifting yields.


ASX 200 Outlook: A Rates Trade Disguised as a Stock Market?
Australian bond futures have exhibited a far stronger relationship with the ASX 200 than Wall Street over recent months. Now both markets are displaying remarkably similar price structures.

StoneX Europe Ltd may make third party material available on this website which may contain information included but not limited to the conditions of financial markets. The material is for information purposes only and does not contain, and should not be construed as containing, investment advice and/or investment recommendation and/or an investment research and/or an offer of or solicitation for any transactions in financial instruments; any decision to enter into a specific transaction shall be made by the client following an assessment by him/her of their situation.
StoneX Europe Ltd makes no representation or warranty and assumes no liability as to the accuracy or completeness of the information provided, nor any loss arising from any investment based on a recommendation, forecast or other information supplied. You should always seek independent advice as to your suitability to speculate in any related markets and your ability to assume the associated risks, if you are at all unsure. We are not under any obligation to update any such material. Any opinion made may be personal to the author and may not reflect the opinion of StoneX Europe Ltd.