



US Dollar and Canadian Dollar Under Pressure as Japanese Yen Attracts Flows
USD/JPY and CAD/JPY show signs of weakness as safe-haven flows boost the Japanese yen. Symmetrical triangle and reversal patterns signal key levels.
Share this:

The Japanese yen is drawing renewed safe-haven demand as geopolitical tensions and tariff risks return to the spotlight. Both USD/JPY and CAD/JPY are flashing technical warning signs, with price action hinting at potential bearish reversals for the US dollar and Canadian dollar against the Japanese yen.
View related analysis:
View related analysis:
USD/JPY Technical Analysis: US Dollar vs Japanese Yen
The weekly chart for USD/JPY suggests the pair remains in a broader downtrend, with price action compressing within a symmetrical triangle — a pattern often interpreted as a bearish continuation formation. The triangle projects a downside target near 136.18, although several support zones between 138.50 and 140.00 could cushion the fall without a fresh catalyst for the Japanese yen or US dollar.
Adding to the uncertainty, USD/JPY is currently trading between its 50-week and 200-week exponential moving averages (EMAs), which further muddies the near-term technical outlook for the US dollar to Japanese yen exchange rate.
Symmetrical triangles typically break in the direction of the prevailing trend — in this case, lower — implying a potential bearish breakout for USD/JPY. However, the pair may continue consolidating within the narrowing range until a definitive move unfolds.
One possible catalyst for renewed Japanese yen strength and US dollar weakness could be renewed tariff concerns, which may shift market focus back toward anticipated Federal Reserve (Fed) rate cuts and weaken the greenback.
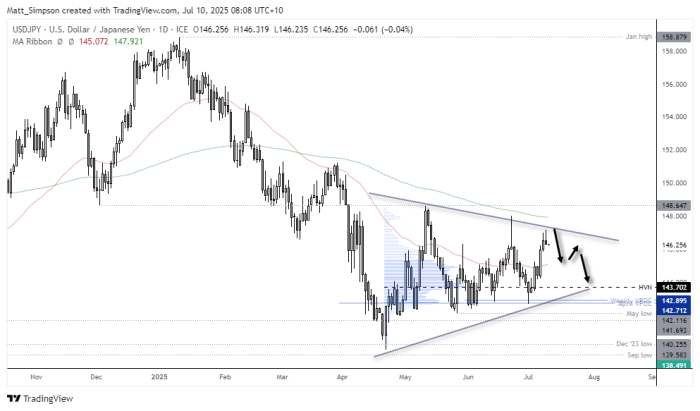
Chart analysis by Matt Simpson - data source: TradingView USD/JPY
USD/JPY Technical Analysis: Daily Chart
A small inverted hammer has formed on the USD/JPY daily chart near the upper triangle trendline — a potential signal of a swing high. The candle formed beneath a previous bearish pinbar and below the 200-day EMA, reinforcing the bearish setup for the US dollar against the Japanese yen.
Short-term bears could consider fading rallies toward yesterday’s high, placing stops above the 20-day EMA (147.9), and targeting a decline toward the 50-day EMA (154.07). A high-volume node (HVN) at 143.70 also offers a realistic short-term target for USD/JPY sellers.
That said, for USD/JPY to break decisively below these levels, a stronger bearish US dollar catalyst — such as rising expectations of Fed rate cuts or weaker inflation data — is likely required.
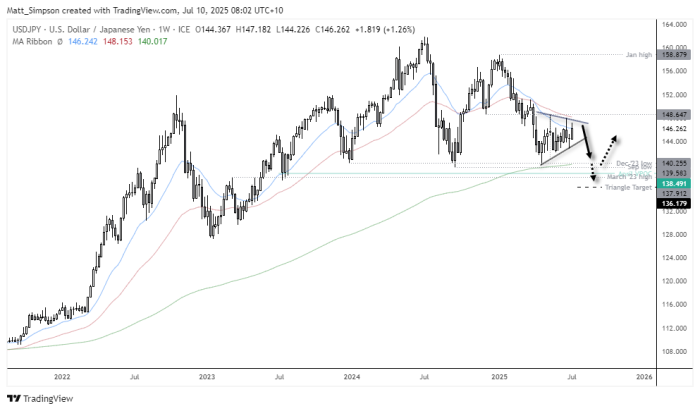
Chart analysis by Matt Simpson - data source: TradingView USD/JPY
CAD/JPY Technical Analysis: Canadian Dollar vs Japanese Yen
A steady uptrend has developed on the CAD/JPY daily chart, with the Canadian dollar advancing above its 50-day EMA and reaching a five-month high overnight. However, a bearish two-day reversal pattern — known as a dark cloud cover — has now formed, suggesting a potential pullback may be on the horizon.
Adding to the caution, the pattern formed near the June high, raising the risk of another false breakout. Similar setups in May and June saw failed breaks above monthly highs, followed by pullbacks of varying depths.
With USD/JPY showing signs of weakness as the Japanese yen attracts safe-haven demand amid renewed tariff headlines, there is scope for CAD/JPY to pull back. Traders may look for a retracement towards the 200-day EMA (currently 106.24) or the ascending trendline that has supported the uptrend since April.
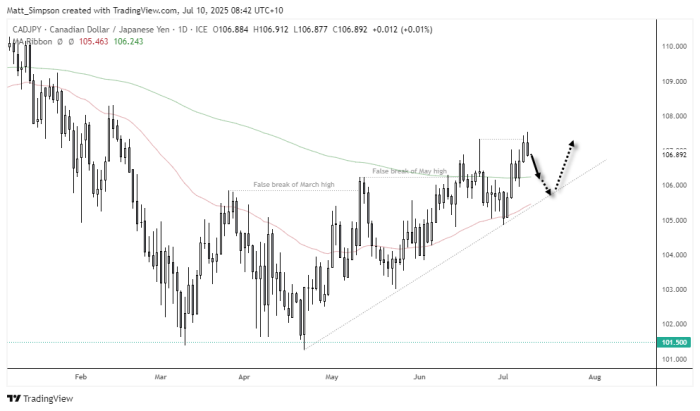
Chart analysis by Matt Simpson - data source: TradingView CAD/JPY
Economic Events in Focus (AEST / GMT+10)
09:50 JPY Foreign Bonds Buying, Foreign Investments in Japanese Stocks, PPI (Jun) (USD/JPY, AUD/JPY, CAD/JPY, EUR/JPY, Nikkei 225)
11:00 KRW Bank of Korea Meeting Schedule, Interest Rate Decision (Jul) (USD/KRW, KOSPI)
16:00 EUR German CPI , HICP (Jun) (EUR/USD, DAX)
20:00 GBP Thomson Reuters IPSOS PCSI (Jul) (GBP/USD, FTSE 100)
20:00 EUR Germany Thomson Reuters IPSOS PCSI (Jul) (EUR/USD, DAX)
22:30 USD Continuing Jobless Claims, Initial Jobless Claims, Jobless Claims 4-Week Avg. (USD/JPY, EUR/USD, USD/CAD, S&P 500, Nasdaq 100, Dow Jones, Gold, Crude Oil)
Friday, July 11
00:30 USD Natural Gas Storage (Crude Oil, Natural Gas)
03:00 USD 30-Year Bond Auction (USD/JPY, EUR/USD, USD/CAD, US Treasuries)
03:15 USD Fed Waller Speaks (USD, US indices)
03:30 GBP BoE Breeden Speaks (GBP/USD, FTSE 100)
04:30 USD FOMC Member Daly Speaks (USD, US indices)
06:30 USD Fed's Balance Sheet, Reserve Balances with Federal Reserve Banks (USD/JPY, EUR/USD, USD/CAD)
Related tags:


The complete CFD trading experience
Award-winning platforms, competitive spreads, low commissions and dedicated support.
We live and breathe the markets and are dedicated to helping traders realise their ambitions as we continue to set the industry bar.
Economic calendar
Web Trader platform
Our sophisticated web-based platform is packed with features.
Related articles
Euro Technical Forecast: EUR/USD Snaps Five-Week Slide at Critical Support 10 17 2026
Euro is attempting to regain its footing as stretched momentum raises the stakes for the next move ahead of key PMI data and central bank decisions.

USD/JPY Weekly Outlook: Volatility Has Left the Building
The yen has ignored broad dollar weakness, falling Treasury yields and renewed market turbulence. Yet its relationship with US interest rates remains intact. So why is USD/JPY going absolutely nowhere fast?


Swiss Franc Forecast: USD/CHF Seven-Week Rally Reverses From Yearly Highs 10 16 2026
A sharp rejection from fresh highs has shifted momentum in favor of USD/CHF bears, raising the stakes for a critical support test.
StoneX Europe Ltd may make third party material available on this website which may contain information included but not limited to the conditions of financial markets. The material is for information purposes only and does not contain, and should not be construed as containing, investment advice and/or investment recommendation and/or an investment research and/or an offer of or solicitation for any transactions in financial instruments; any decision to enter into a specific transaction shall be made by the client following an assessment by him/her of their situation.
StoneX Europe Ltd makes no representation or warranty and assumes no liability as to the accuracy or completeness of the information provided, nor any loss arising from any investment based on a recommendation, forecast or other information supplied. You should always seek independent advice as to your suitability to speculate in any related markets and your ability to assume the associated risks, if you are at all unsure. We are not under any obligation to update any such material. Any opinion made may be personal to the author and may not reflect the opinion of StoneX Europe Ltd.