




US Dollar Price Action Setups into FOMC: GBP/USD, USD/JPY
Next week is huge for the U.S. Dollar as we have the Fed, PCE and Non-Farm Payrolls. This is the type of week when new trends can quickly form.
Share this:

US Dollar Talking Points:
- The US Dollar started the week with a continuation of weakness but pulled back on Thursday and Friday.
- Next week’s economic calendar is huge with FOMC on Wednesday, Core PCE on Thursday and Non-farm Payrolls on Friday.
- I’ll be looking at updated charts in the pre-FOMC webinar on Wednesday and you’re welcome to join. Click here to register.
President Trump has a way of commanding attention and it was his threat to fire Jerome Powell last week that stunted a rally in the U.S. Dollar, and that theme carried through to the new week, even with Trump saying that he probably wasn’t going to do it.
But for the week ahead the driver will likely come from something other than threats unlikely to happen, as the FOMC rate decision on Wednesday will see the rubber hit the road and whether the Fed begins to lay the groundwork for rate cuts to start this year. At present markets are widely expecting at least 50 bps of cuts by the end of 2025. After Wednesday, there are only three rate decisions at the Fed until the end of the year so logically, if they are going to begin cutting they would want to start readying markets ahead of time.
Thursday then brings the Fed’s preferred inflation gauge of Core PCE, and it was on the CPI print earlier in the month that USD-strength continued to show, until the morning after when Trump threatened to fire Powell. The day after, on Friday, we get Non-farm Payrolls and strength in the labor market could be yet another reason for the Fed to refrain from cutting rates at the September meeting.
All in all, this is the kind of week that can create new trends and in the USD, the currency remains very near the same spot of support that came into play to hold the lows back in April. Bears have had several opportunities to run fresh lows but, so far, haven’t been able to break much ground below that prior swing.
U.S. Dollar Weekly Chart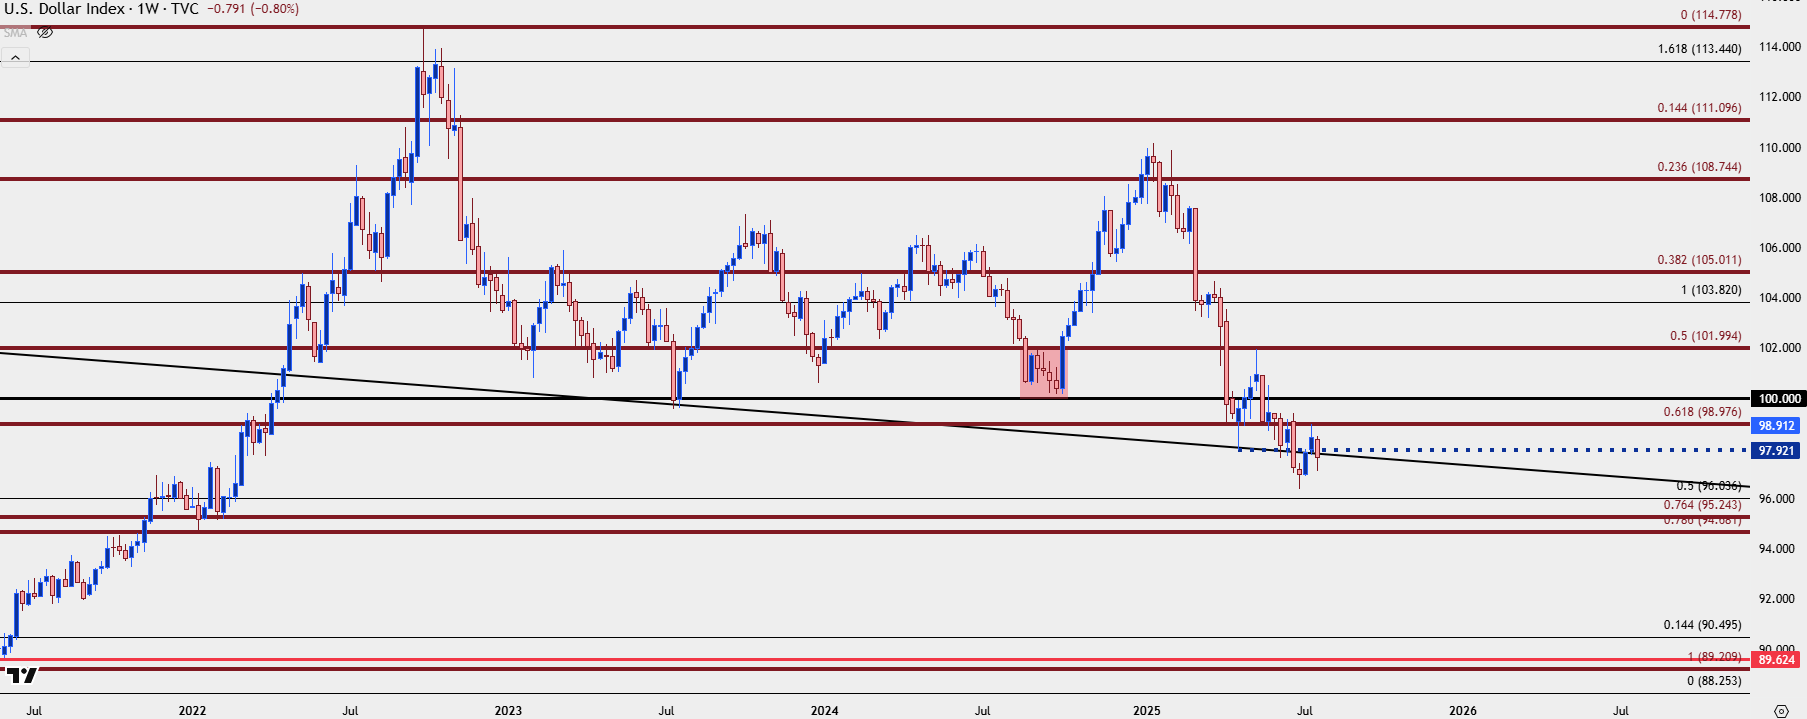
Chart prepared by James Stanley; data derived from Tradingview
The 98-zone around DXY has been well-tested of late, on both sides of the matter. This was resistance a couple of weeks ago, ahead of the CPI-fueled breakout, and it was support in April and again in June. As we wind towards the end of this week it is back in as resistance and this highlights another level of importance overhead at the 98.98 level, which is a Fibonacci retracement that held the highs following that CPI-driven breakout in the prior week.
While the trend has been clearly lower, with bears continuing to respond to resistance, the bigger issue on the short side of the USD is how bears have suddenly gotten shy around tests of prior lows which is what led to the higher-low that’s held so far this week.
U.S. Dollar Daily Chart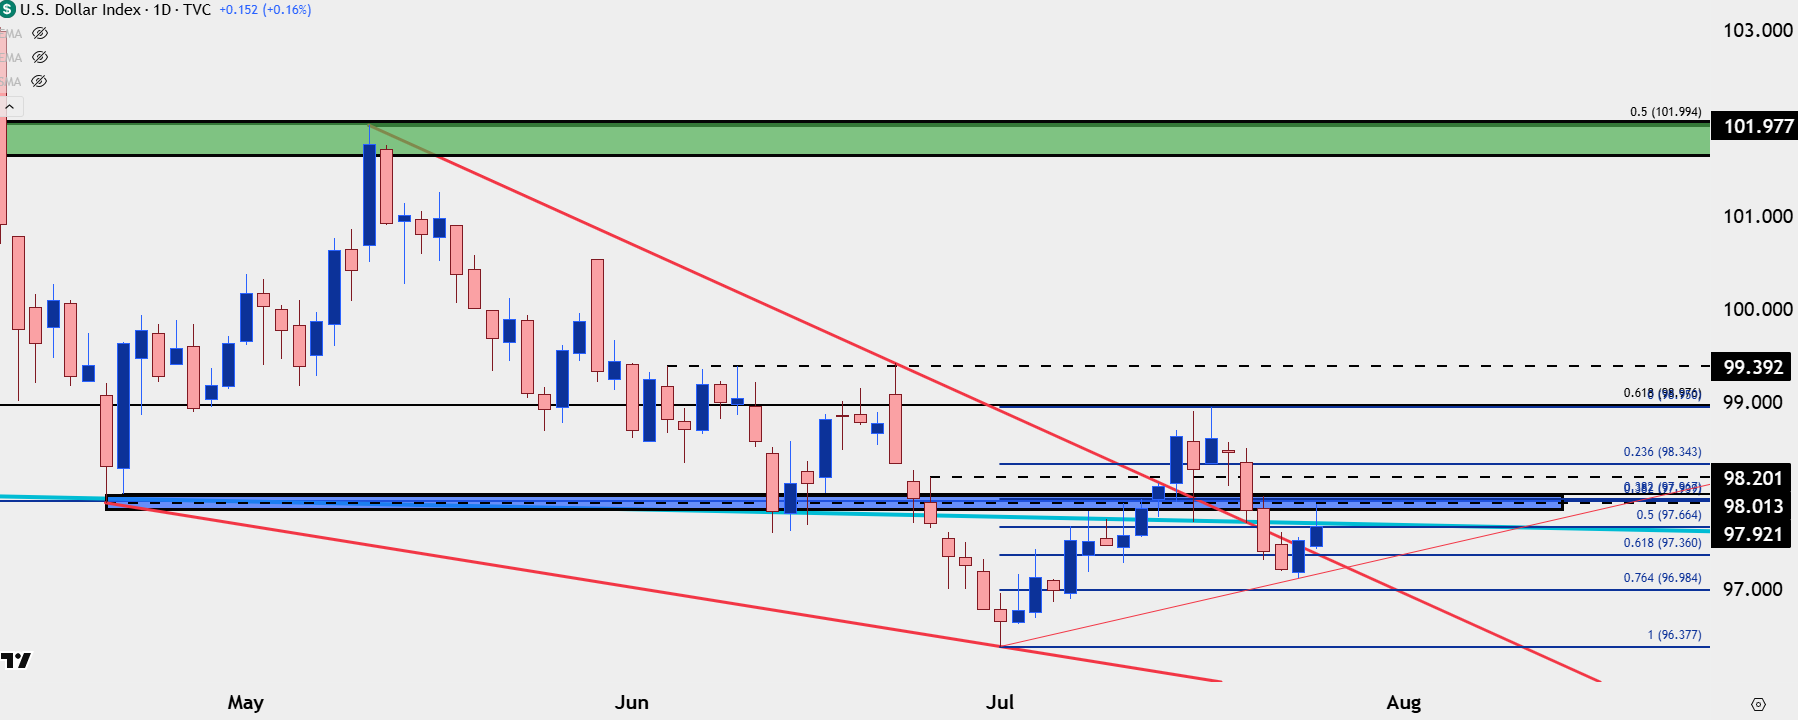
Chart prepared by James Stanley; data derived from Tradingview
EUR/USD
In the Tuesday webinar I looked at resistance structure in EUR/USD and the first level overhead came into play after the Thursday ECB reaction. As we wind into the end of the week, that’s the price that’s held the highs and while the four-hour chart below can be argued for both bullish and bearish scenarios, the bigger picture has seen a similar stalling near the highs as we’ve seen near the lows in the USD backdrop above.
EUR/USD Four-Hour Chart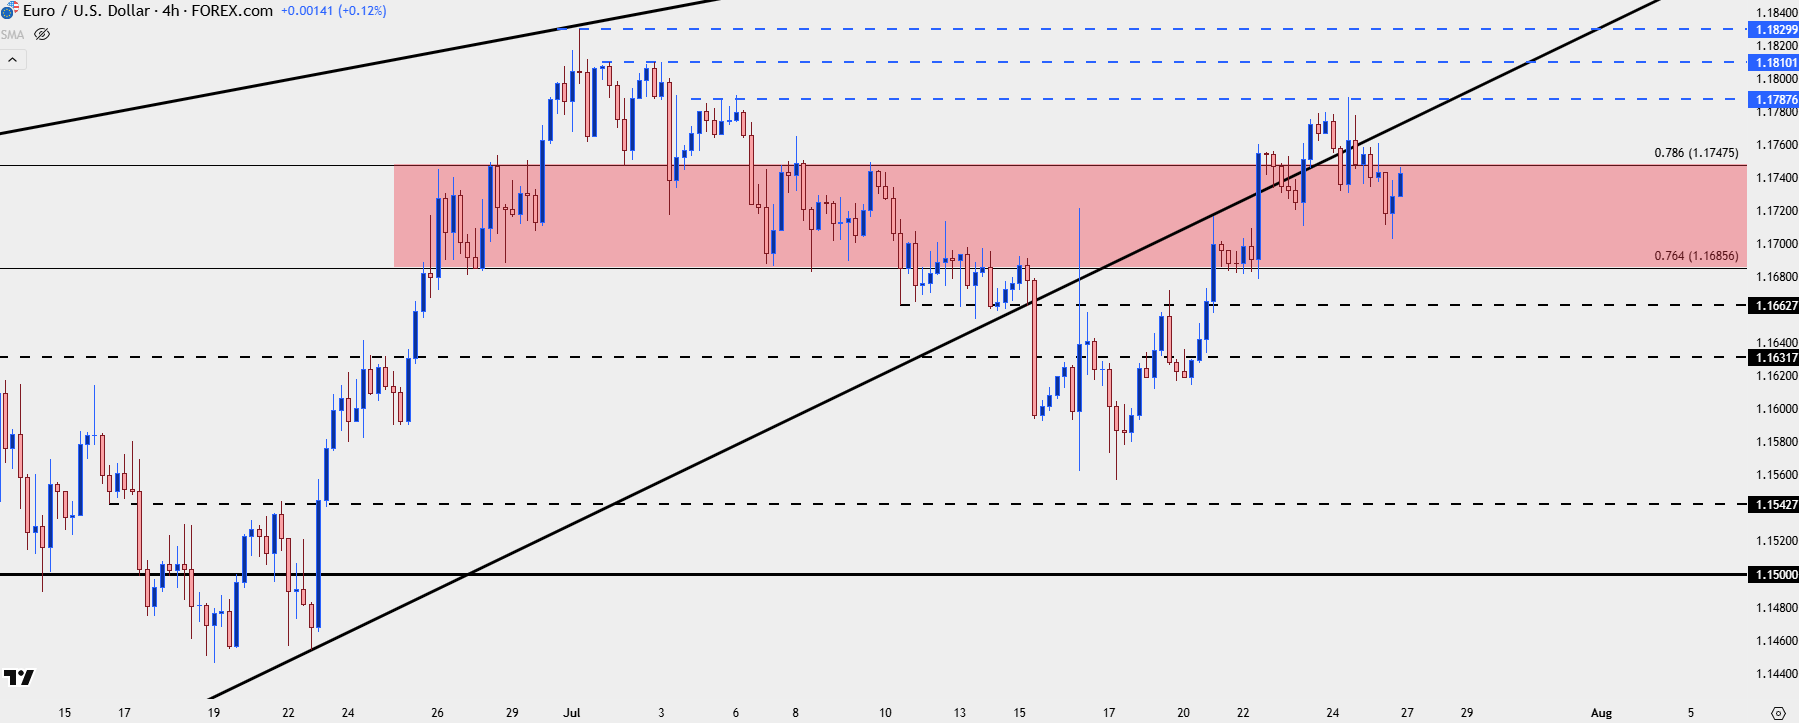
Chart prepared by James Stanley; data derived from Tradingview
GBP/USD
For USD-weakness scenarios I still favor GBP/USD, and the pair has seen price revert back to a key zone of support that had helped to hold the lows both in the week prior and in late-June. One thing to note is the brewing head and shoulders pattern, which is often tracked for breakdown potential. If that comes to fruition, I think USD-strength would be more attractive in EUR/USD shorts, but this puts focus on the neckline in GBP/USD in the event that the formation does trigger. Given next week’s calendar around the U.S., this would seem certainly possible if the dominos fall in a certain way.
GBP/USD Daily Price Chart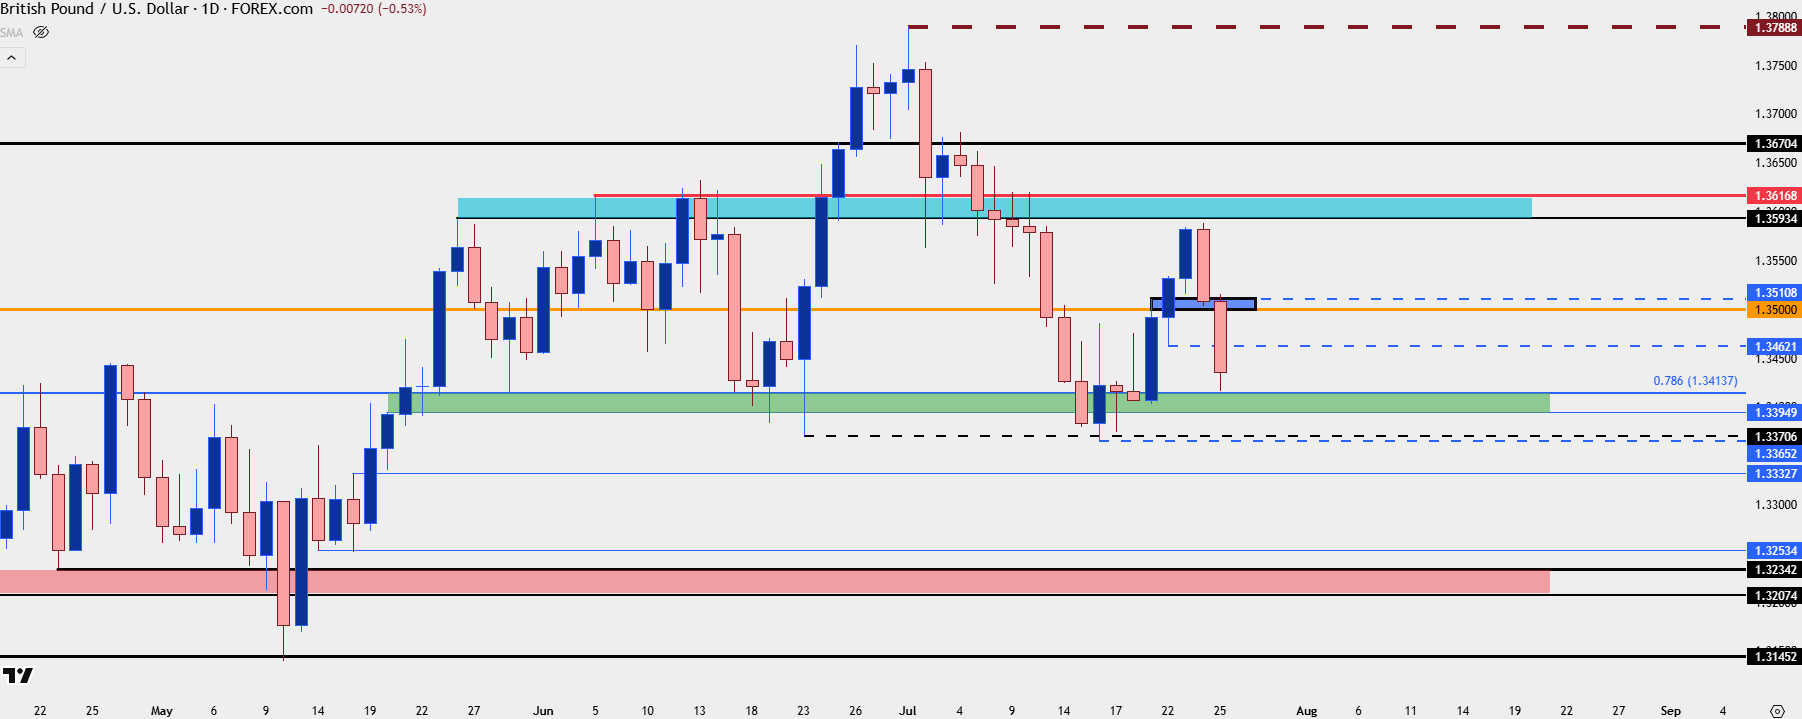
Chart prepared by James Stanley; data derived from Tradingview
USD/JPY
I wrote about USD/JPY quite a bit in the past week as the volatility there has been exceptional of late, at least on a short-term basis. The sell-off that started at the weekly open saw price draw down to a low of 145.92, which I had highlighted in the Monday video and article. That support came into play on Wednesday night and led to a 200+ pip reversal as price pushed all the way up to the Fibonacci level of 147.94, which has held the highs into the end of the week.
USD/JPY remains a hot button for broader USD trends and the Bank of Japan rate decision on Wednesday night/Thursday morning will likely keep the pair as volatile.
For strategy – there’s now support potential at prior resistance of 147.21.
USD/JPY Four-Hour Chart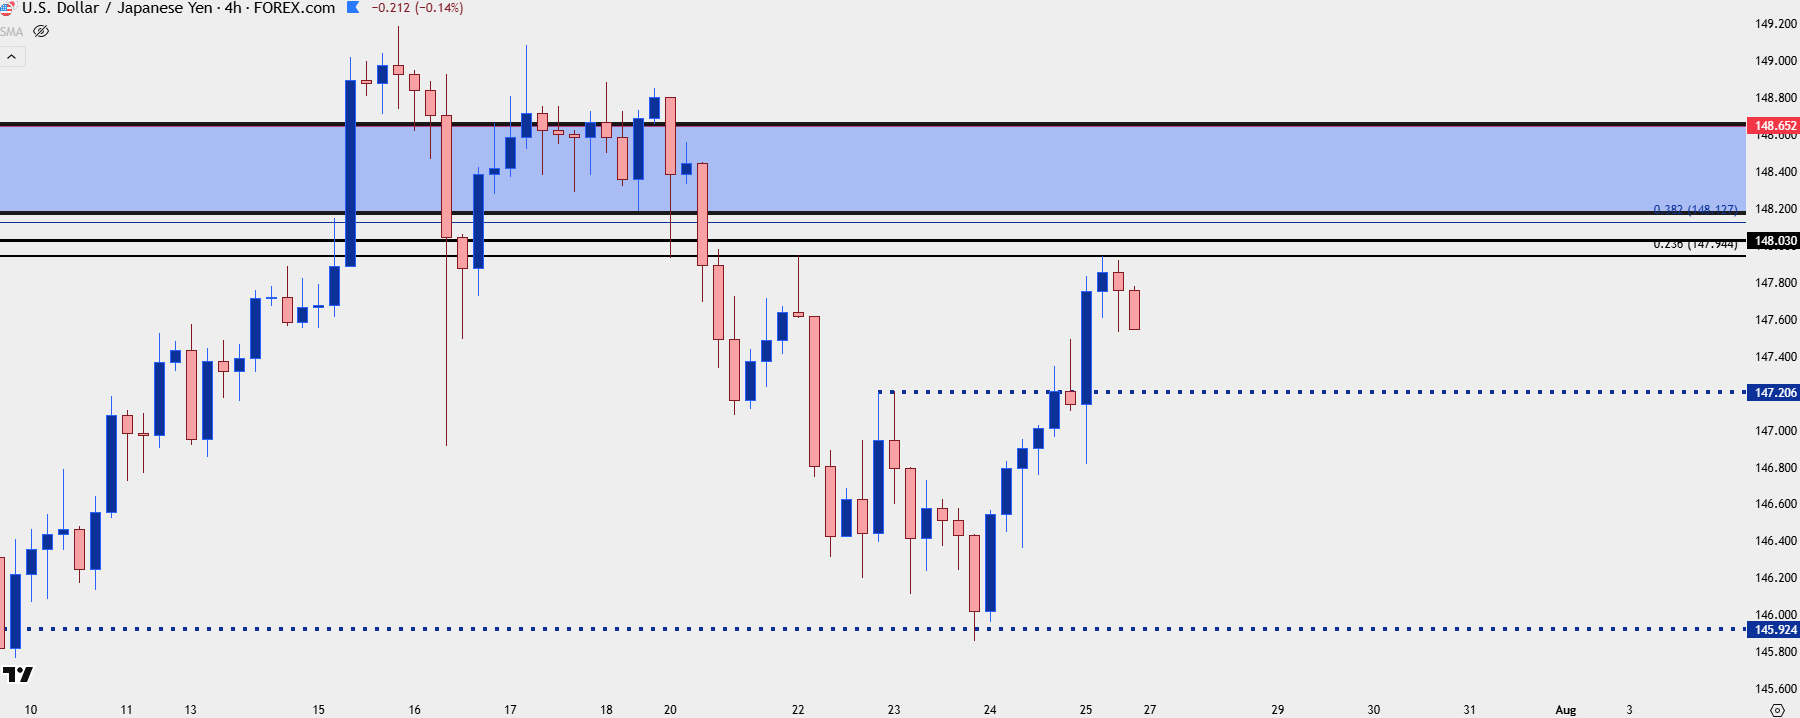
Chart prepared by James Stanley; data derived from Tradingview
USD/CAD
I wrote a longer article about USD/CAD earlier today and in that piece, I looked at an ascending triangle formation that’s been setting up with another trendline hold of support this week.
The bigger picture range in the pair can still favor bears but timing is of issue, as the same theme looked at in USD above has been more pronounced of late in USD/CAD, where sellers have suddenly dried up as we near tests of fresh lows. In USD/CAD, there’s also a Bank of Canada rate decision for next week, and this highlights deeper resistance potential at 1.3798, 1.3889-1.3905 and then around the 1.4000 zone.
USD/CAD Weekly Chart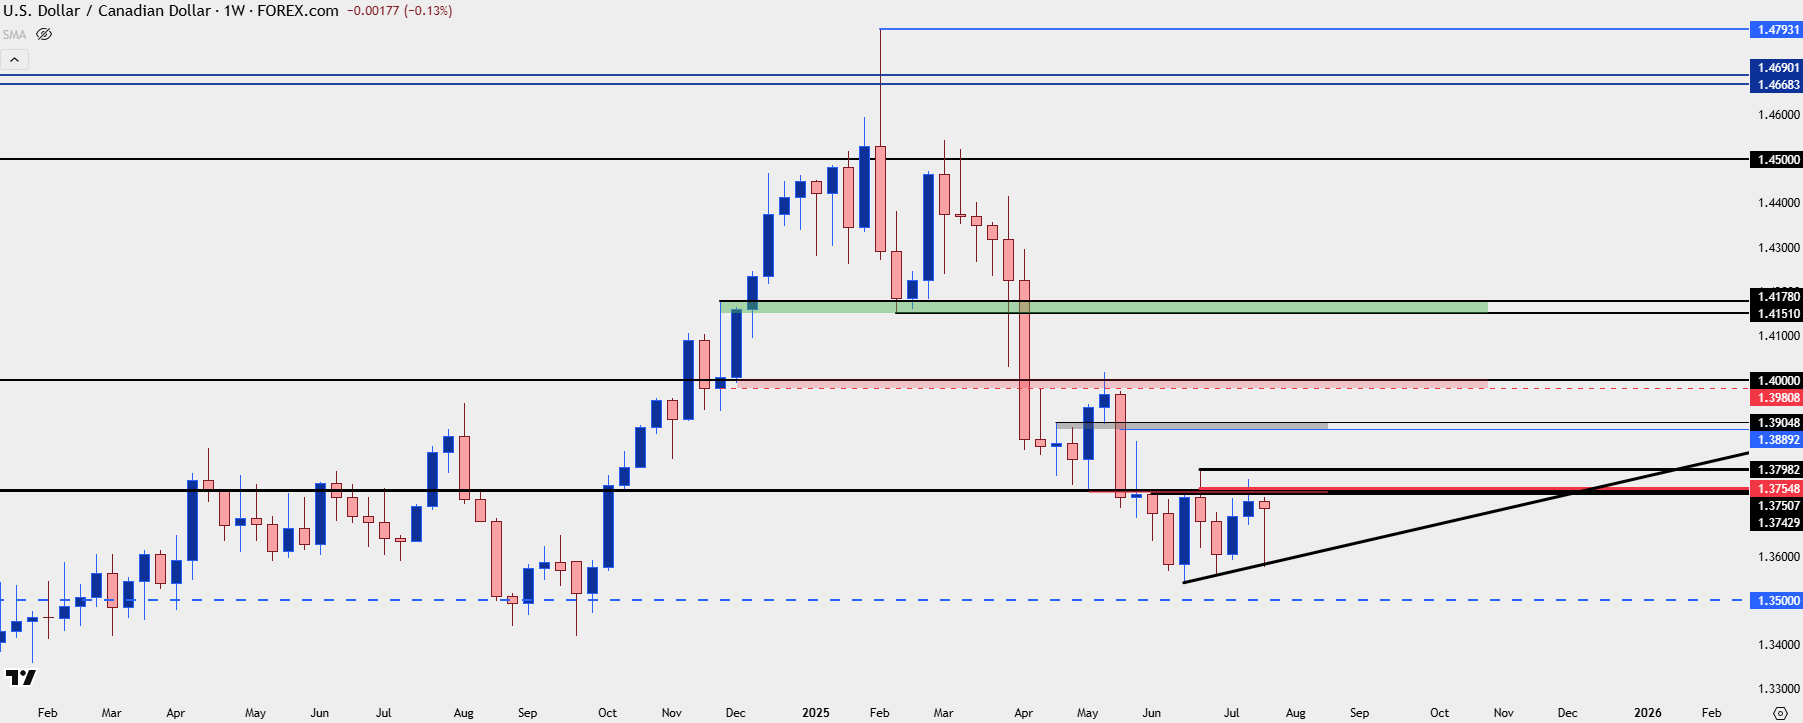
Chart prepared by James Stanley; data derived from Tradingview
--- written by James Stanley, Senior Strategist



The complete CFD trading experience
Award-winning platforms, competitive spreads, low commissions and dedicated support.
We live and breathe the markets and are dedicated to helping traders realise their ambitions as we continue to set the industry bar.
Economic calendar
Web Trader platform
Our sophisticated web-based platform is packed with features.
Related articles

EUR/USD Forecast: Euro Struggles to Find Support Even After U.S. PCE Data
The euro continues to face a challenging environment in the short term. The currency has struggled to regain ground against a U.S. dollar that remains firmly supported, a dynamic reflected in EUR/USD, which has now recorded three consecutive losing sessions and a decline of roughly 0.6%.


Canadian Dollar Forecast: USD/CAD Four-Week Rally Eyes Yearly Highs 9 30 2026
USD/CAD has advanced in 14 of the past 15 sessions, but stretched momentum raises the stakes as major resistance and NFP come into focus.


British Pound Technical Outlook: GBP/USD Rebound Challenges September Downtrend 9 30 2026
Sterling has rallied sharply from key support, with GBP/USD at an inflection point that could determine whether a larger recovery is underway.
StoneX Europe Ltd may make third party material available on this website which may contain information included but not limited to the conditions of financial markets. The material is for information purposes only and does not contain, and should not be construed as containing, investment advice and/or investment recommendation and/or an investment research and/or an offer of or solicitation for any transactions in financial instruments; any decision to enter into a specific transaction shall be made by the client following an assessment by him/her of their situation.
StoneX Europe Ltd makes no representation or warranty and assumes no liability as to the accuracy or completeness of the information provided, nor any loss arising from any investment based on a recommendation, forecast or other information supplied. You should always seek independent advice as to your suitability to speculate in any related markets and your ability to assume the associated risks, if you are at all unsure. We are not under any obligation to update any such material. Any opinion made may be personal to the author and may not reflect the opinion of StoneX Europe Ltd.