
Japanese Yen Talking Points:
- It was a public holiday in Japan but election results pushed a large move of Yen-strength.
- The bigger question now is digestion of the news that saw the LDP lose their majority in the upper chamber. The initial inkling was that with the changing political backdrop there could usher in a change in policy, but that remains questionable as political fragility could constrain the BoJ from additional tightening.
- I’ll be looking into all three JPY pairs in tomorrow’s webinar, and you’re welcome to join. Click here to register.
Chasing USD/JPY breakouts continues to be a perilous endeavor as price has snapped back from last week’s bullish push to fresh three-month highs. The reason cited across many publications is the Japanese election results that came in and perhaps this does have some impact. But with the LDP losing their majority in the upper chamber it would seem that less political security would make for a more challenging backdrop for the Bank of Japan to hike rates. Nonetheless, the next 24 hours will be key as Japanese markets re-open from public holiday and we’ll be able to get a broader reaction to those election results.
In USD/JPY, price is nearing a point of support as taken from the 61.8% Fibonacci retracement of the September-January move. This was what caught the lows last Wednesday as USD-weakness was rushing in after President Trump threatened to fire Jerome Powell.
USD/JPY Four-Hour Price Chart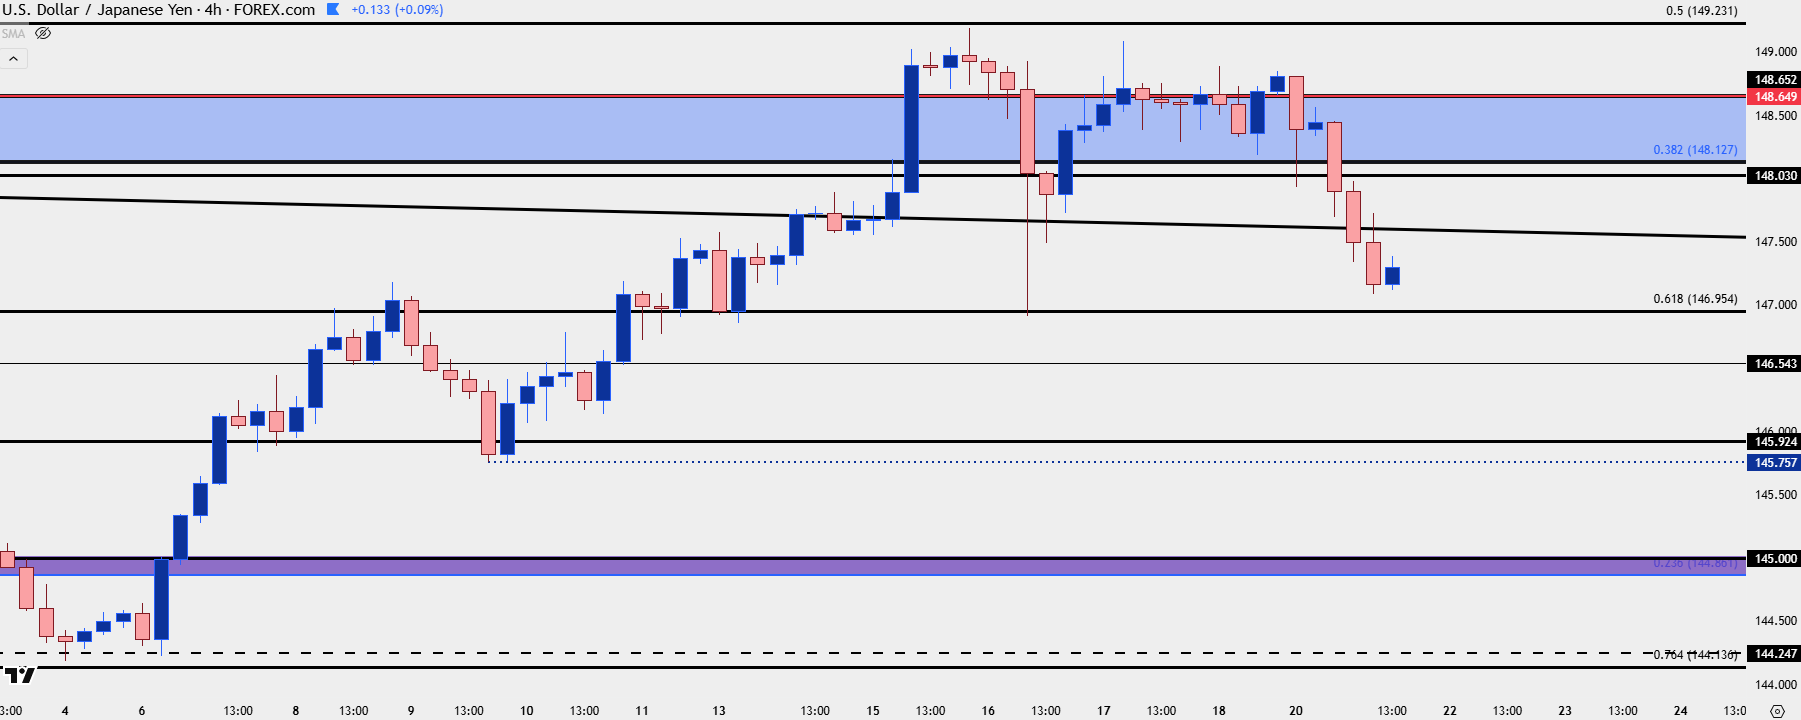
Chart prepared by James Stanley; data derived from Tradingview
USD/JPY Structure
Given the overhead resistance that I looked at last week it’s not surprising that bulls were stalled so close to the 150.00 handle. Interestingly, last week’s high shows right at the 50% mark of the same Fibonacci retracement highlighted above, and just over that retracement level is both the 200-day moving average and the psychological level of 150.00, which has been a point of drama in the pair over the past few years in varying ways.
The question now is whether bulls come in to show support, and below the 61.8% Fibonacci level, there’s prior price swings at 146.54 and 145.93; and even the 145.00 psychological level of prior resistance could function as support, although a drop all the way down to that level should come with question around bullish continuation potential.

USD/JPY Daily Price Chart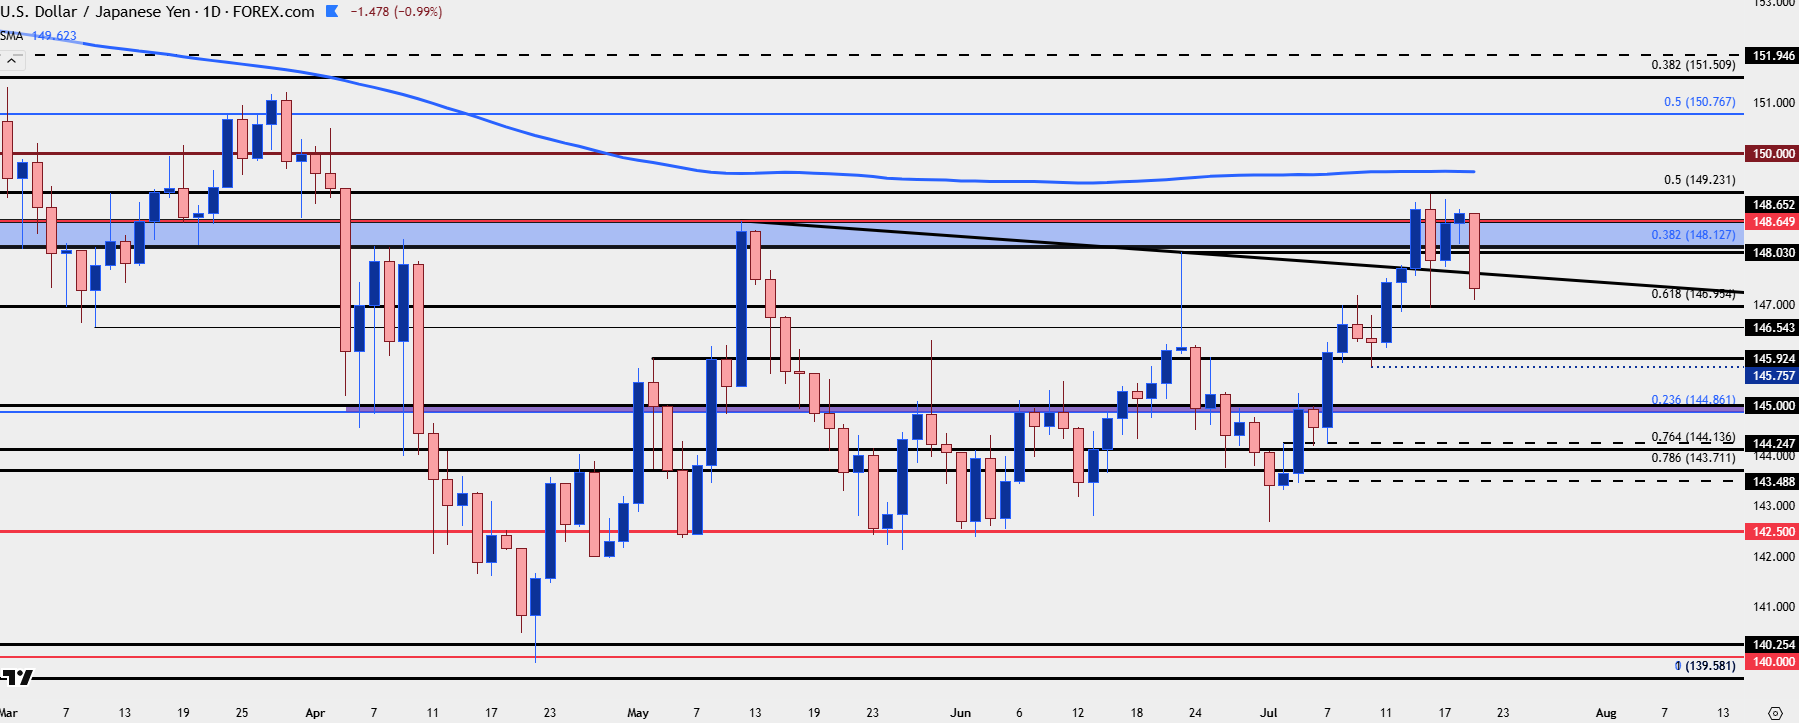
Chart prepared by James Stanley; data derived from Tradingview
GBP/JPY
For JPY-weakness I still prefer GBP/JPY, and the backdrop in GBP/USD highlights that drive as Cable has continued to rally from a key spot of support. I looked at GBP/JPY in last Monday’s article and video and at the time, the pair was finding support at the 198.08 level. As I had highlighted then, the 200.00 psychological level came with some drama, and last week’s high posted a mere 2.5 pips below the big figure.
As I shared in the video, this doesn’t necessarily mean reversals are in-play, and if anything, that very logical reason for bulls to have pulled back so near the big figure can keep the door open for continuation.
But, like looked at in the EUR/JPY example, it took weeks for the pair to finally gain acceptance above the 170.00 level, and a similar story could easily brew up around the GBP/JPY pair.
For the past two weeks, GBP/JPY has been range-bound and we’re very near the support side of that range, as of this writing.
GBP/JPY Four-Hour Price Chart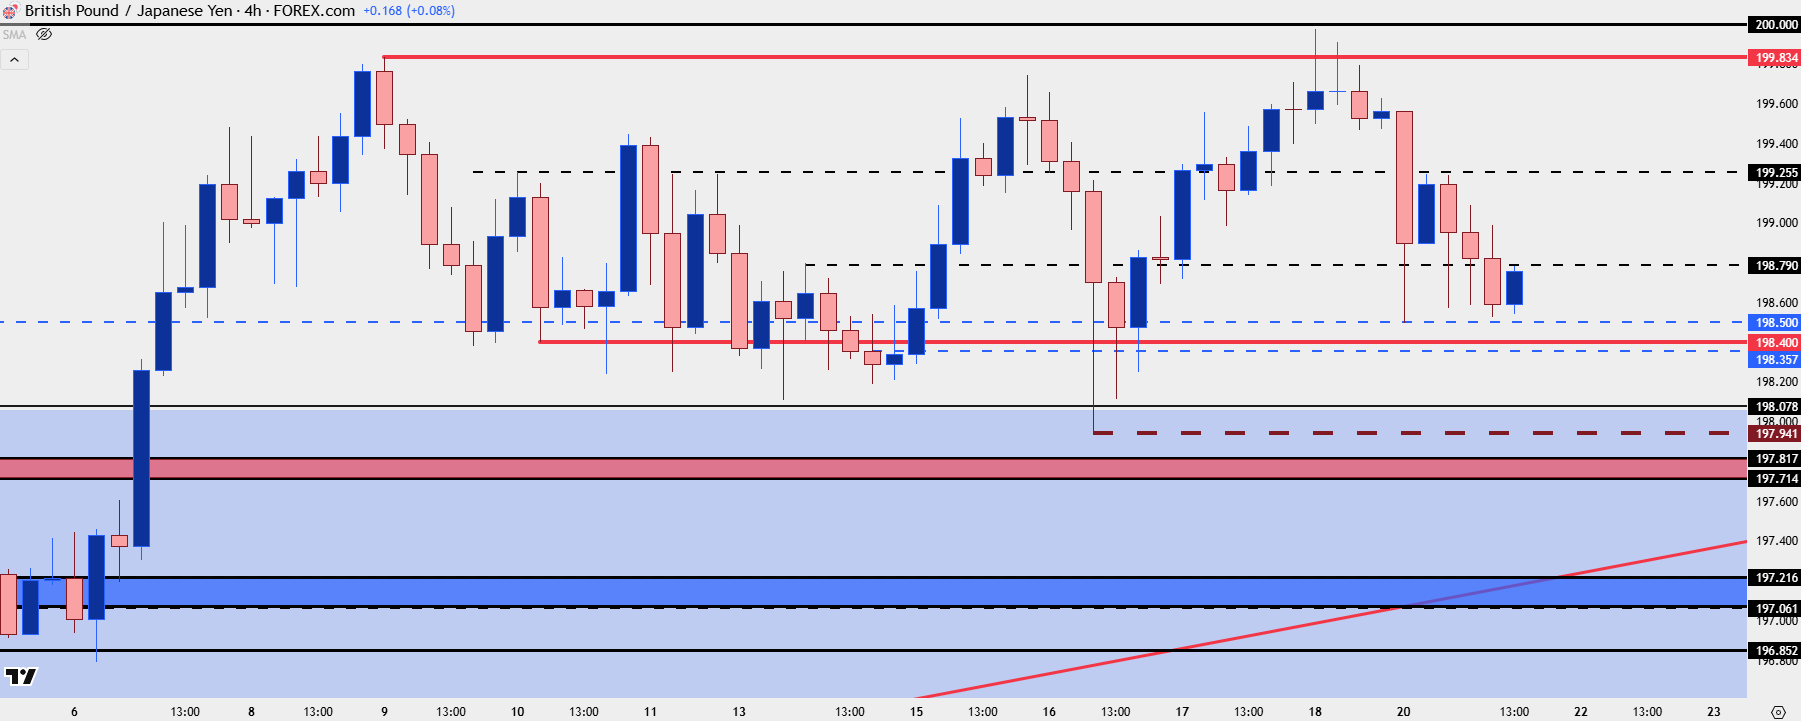
Chart prepared by James Stanley; data derived from Tradingview
EUR/JPY
EUR/JPY has been a high-flyer with RSI going overbought on both daily and weekly charts and while those conditions have eased a bit, it’s still difficult to chase the pair, at this point. Also of note is the fact that while GBP/JPY set a fresh high last Friday, coming very close to that test at 200.00 – EUR/JPY did not, instead holding at a lower-high. I went over this difference in the video and this could be symptom of a heavily long market taking profits as price came very close to re-testing that high. This is something that could also lead-in to deeper pullback or retracement, although it doesn’t necessarily mean that the pair has to reverse.
For support, there’s a swing low at 171.78 and below that, Fibonacci levels at 170.93 and 170.47, with the 170.00 psychological level lurking below that.
EUR/JPY Daily Price Chart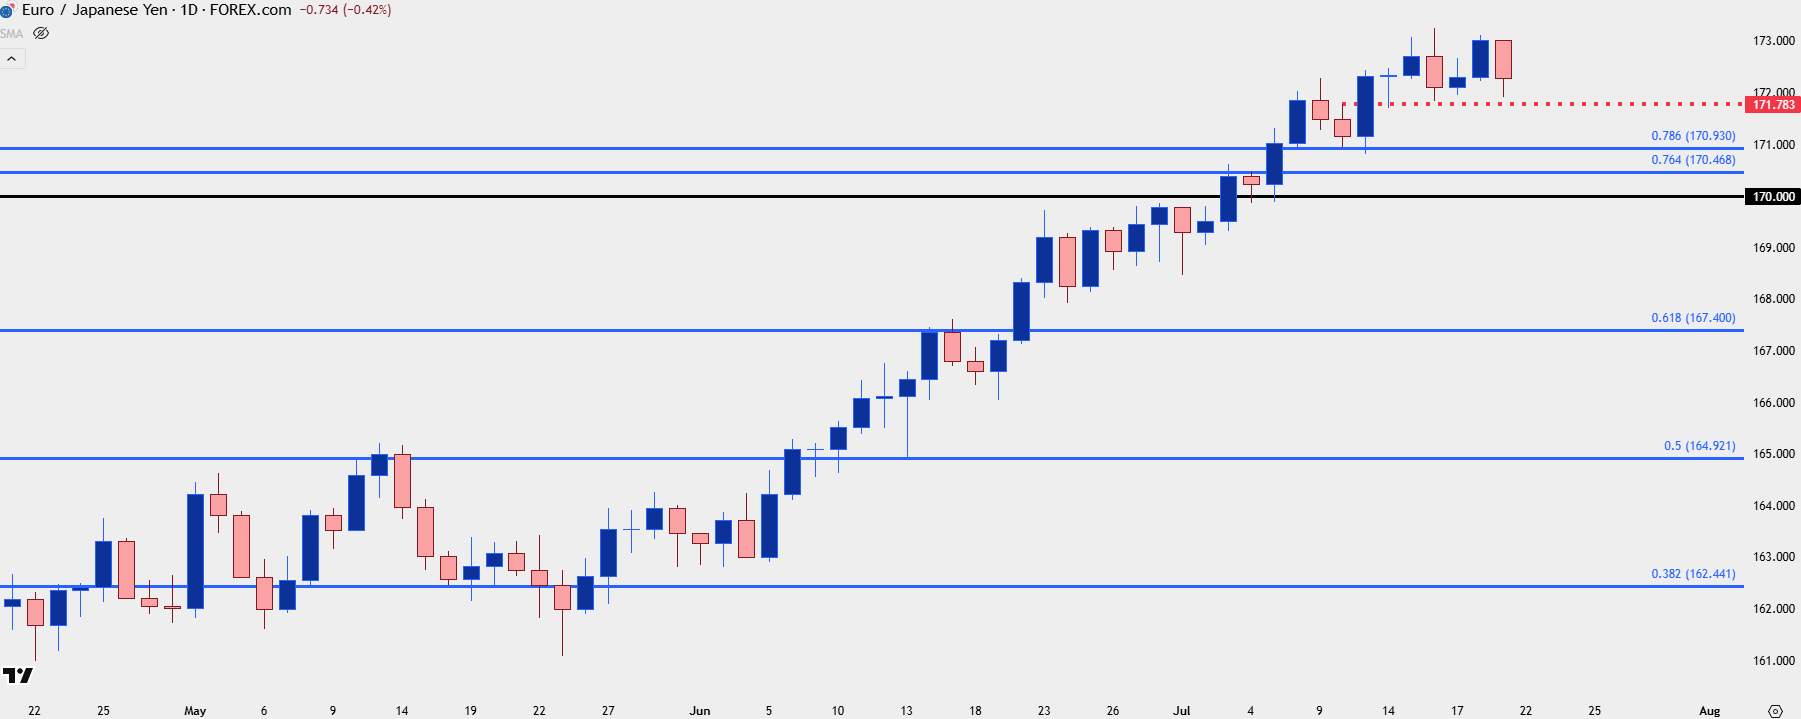
Chart prepared by James Stanley; data derived from Tradingview
--- written by James Stanley, Senior Strategist