
Canadian Dollar Outlook: USD/CAD Talking Points:
- USD/CAD fell through early trade this week but found support at a key trendline connecting June and July swing lows.
- That support came into play on Wednesday and shorts have been getting squeezed since, with price now back to a familiar zone of resistance just inside of the 1.3700 level.
- Next week brings a rate decision out of both Canada and the United States, with the big question as to whether the FOMC begins to lay the groundwork for rate cuts to start in September.
- I’ll be previewing the FOMC rate decision in U.S. Dollar Price Action Setups on Tuesday. Click here to register.
Bulls haven’t exactly been able to take control of the longer-term chart in USD/CAD just yet, but sellers haven’t exactly had a free reign, either. The 1.3750 level that came into play as support in May remains in the picture today, with resistance from that level having held the highs multiple times over the past eight weeks. Perhaps more disconcerting for sellers is the lack of aggression upon tests of prior lows, which has allowed for the build of a bullish trendline when taken from June and early-July swing lows, and that trendline was in-play this week, helping to set the low on Wednesday after which a strong rally took over in the back half of the week.
USD/CAD Four-Hour Price Chart
Chart prepared by James Stanley; data derived from Tradingview
USD/CAD Ascending Triangle
At this point the past two months of price action in USD/CAD has built a bullish reversal setup in the form of an ascending triangle. The horizontal resistance from prior support at 1.3750 marks the line of resistance, with the higher-lows as shown from the repeated failures from bears to push down to the 1.3500 handle.
These formations are often approached with aim of bullish breakouts, that the diminishing impact of resistance can, eventually, lead to buyers taking control of the matter.
Given how aggressive the sell-off was in the first-half of the year, that can make sense and it can even be considered within the context of a larger bearish picture, as the almost decade-long range still very much applies.
This also wouldn’t be all that different from the episode that showed around the middle of Q2, when prices had initially stalled at that 1.3750 level and, eventually, rallied up for a resistance test at the 1.4000 handle. Ultimately that price marked the highs as sellers got back in the driver’s seat, but a familiar sense of stall has since appeared just above the 1.3500 level.

USD/CAD Weekly Price Chart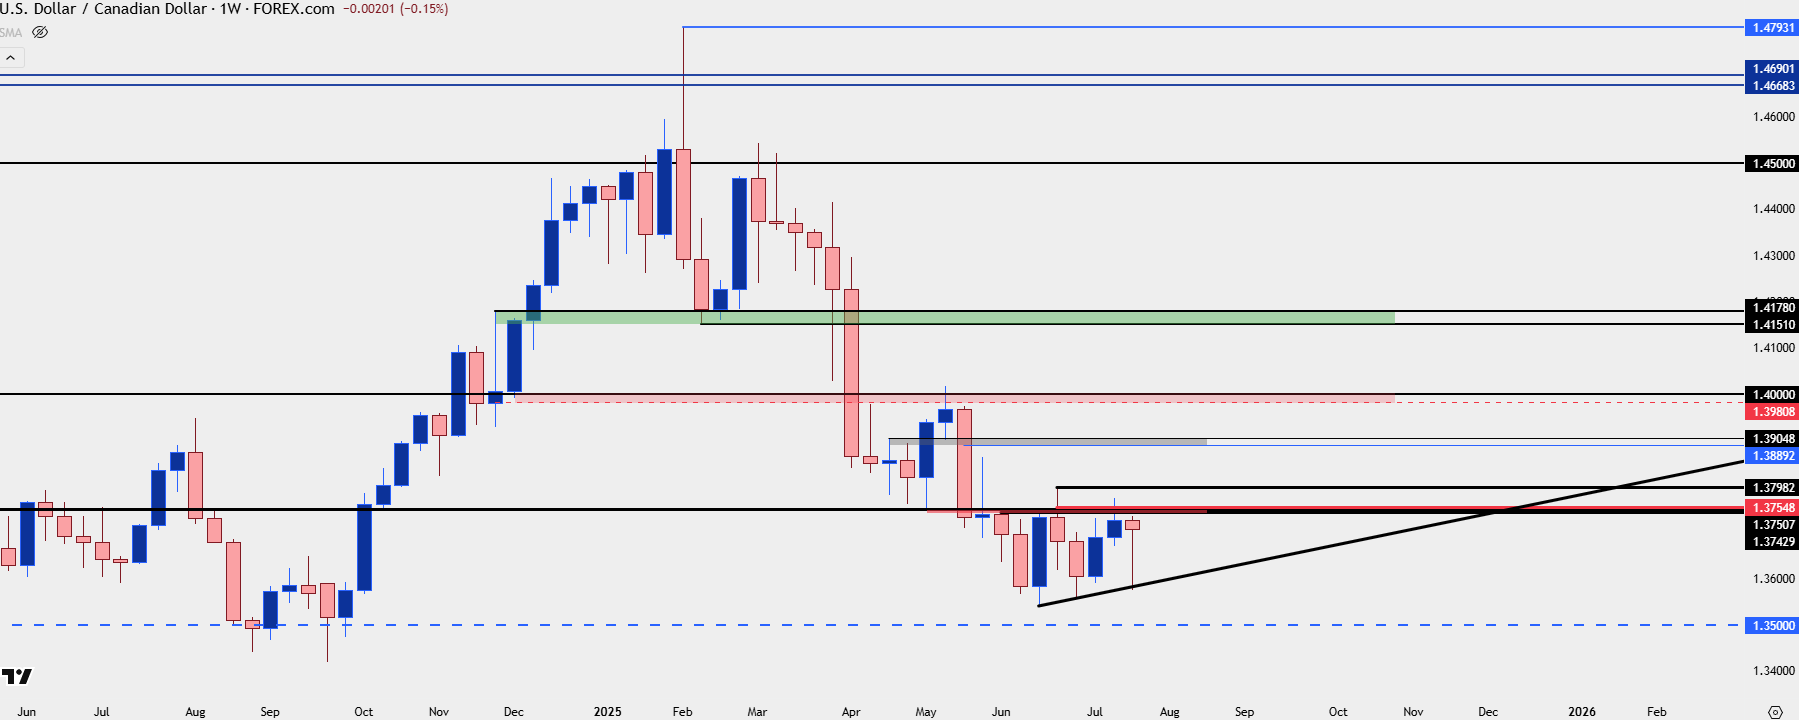
Chart prepared by James Stanley; data derived from Tradingview
USD/CAD Levels and Strategy
Ascending triangles are not foregone conclusions and it does not mean that price has to reverse. The formation triggers or activates on a breach of resistance and in this case that would mean a break of that 1.3750 zone. In that event, there’s then follow through resistance at 1.3794 and then the 1.3889-1.3905 zone, after which the 1.4000 handle comes into play.
If we do see a prolonged case of USD-strength, even the 1.4151-1.4178 zone can come into the picture and while the shorter-term chart would take on a very bullish look, as we can see above from the weekly, that could be a resistance test that gets bears back in position to drive into the longer-term range.
The challenge for sellers at this point, without a larger correction or pullback, is just how oversold the move had become following the massive drop back in April that extended through May. This is what’s allowed for the higher-lows to build, even as the USD was setting a fresh three-year low on the first day of Q3 trade.
So – if we do see a stretch from sellers next week, which when given both a Bank of Canada and an FOMC rate decision, there’s the possibility of bullish reversal upon the test of fresh lows, particularly if we can see sellers stretch all the way down for a test of that 1.3500 level. Again, this wouldn’t necessarily mean that the bigger picture trend has shifted as much as price going into pullback to rectify an already-stretched move.
USD/CAD Daily Chart
Chart prepared by James Stanley; data derived from Tradingview
--- written by James Stanley, Senior Strategist