



US Dollar Price Action Setups: USD/JPY, EUR/USD, GBP/USD
The US Dollar held support at prior resistance even with below-expected CPI and PPI data, but the true test of trend for next week likely dials back to the European Central Bank and whether EUR/USD bears make a move.
Share this:

US Dollar Talking Points:
- The USD retains a bullish lean from daily and weekly charts and that has held over the past week despite below-expected inflation data on Tuesday and Wednesday.
- As looked at in the Tuesday webinar, the response to counter-trend stimuli is telling for trend construction, and the question for next week is whether EUR/USD bears can make a push-lower as the pair has stalled just below the 1.1500 handle.
The true test of trend is what happens in the face of counter-trend stimuli. Do bulls come in to defend the higher-low, looking at the sell-off as opportunistic? Or do they cut bait and run, allowing for further support breaks and an opening door for reversal potential.
We had such a scenario this week in the USD, where both CPI and PPI printed below expectations. Markets are still primed for rate hike potential into the end of the year and that’s helped to keep the USD in a bullish spot from both weekly and daily charts.
US Dollar Weekly Chart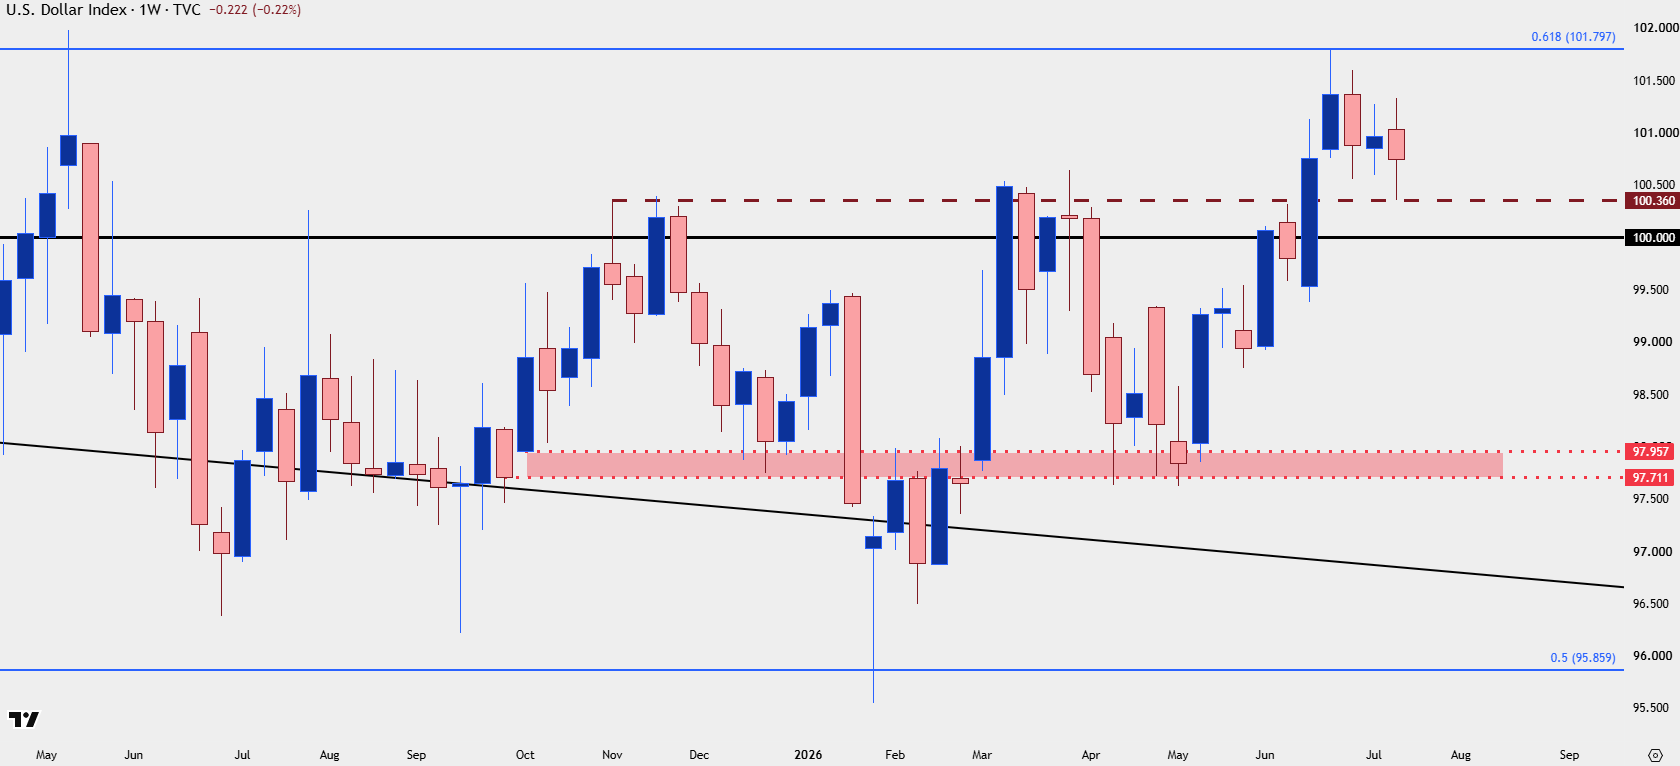
Chart prepared by James Stanley; data derived from Tradingview
With US rate hike expectations still holding despite that below-expected CPI and PPI data, USD/JPY retains breakout potential.

I looked into this one in-depth on Monday, highlighting the fact that a below-expected inflation print could allow for pullback, which is what happened. And then buyers jumped on the bid which further highlights bullish continuation potential as there’s now been a continuation of higher-lows.
At this point, buyers haven’t yet wanted to test beyond the 163 level, and that’s helped to create a symmetrical triangle which normally is a non-directional formation. But given the prior trend, that triangle points to a bull pennant formation, which retains a topside bias for continuation scenarios and this remains my most attractive venue for USD-strength.
USD/JPY Daily Price Chart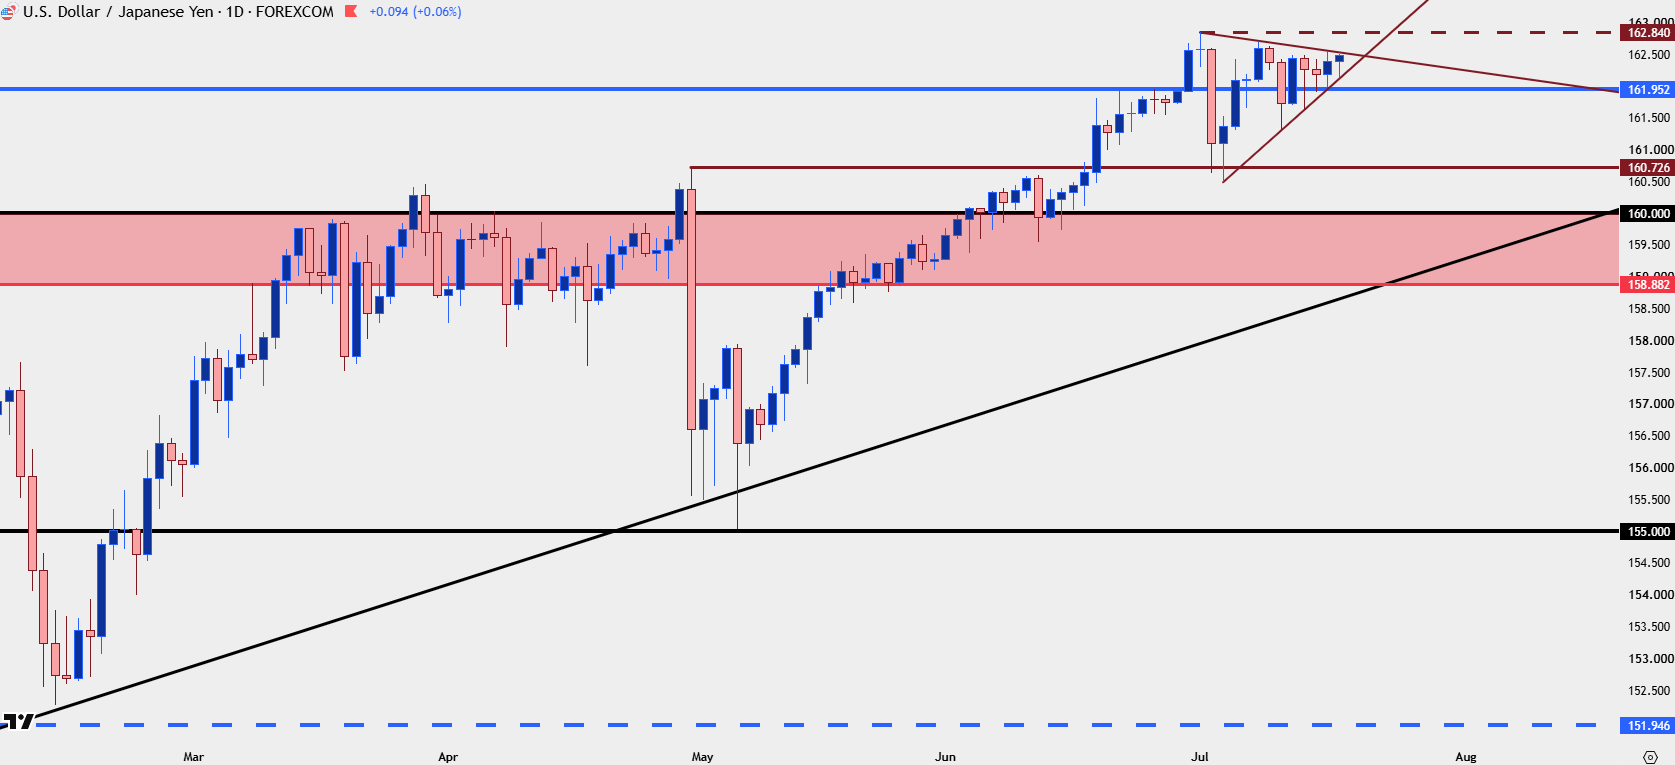
Chart prepared by James Stanley; data derived from Tradingview
EUR/USD
For next week, I think EUR/USD carries a lot of weight for the USD and in-turn, major FX pairs. There’s an ECB rate decision on Thursday and since the breakdown in the pair in late-June, there’s been stalling over the past few weeks. So far, we’ve had a hold of resistance around 1.1469, but the higher-lows that have built over the past few weeks suggest that the move is already well priced-in and I think ideally, a counter-trend move with a test up to or around 1.1500 could make for a more attractive backdrop for bears.
There’s the risk of a short-squeeze type of scenario, as well, so I want to circle a deeper resistance zone in that event and for that, there’s a prior support-turned-resistance area running from 1.1576 up to 1.1613.
EUR/USD Daily Chart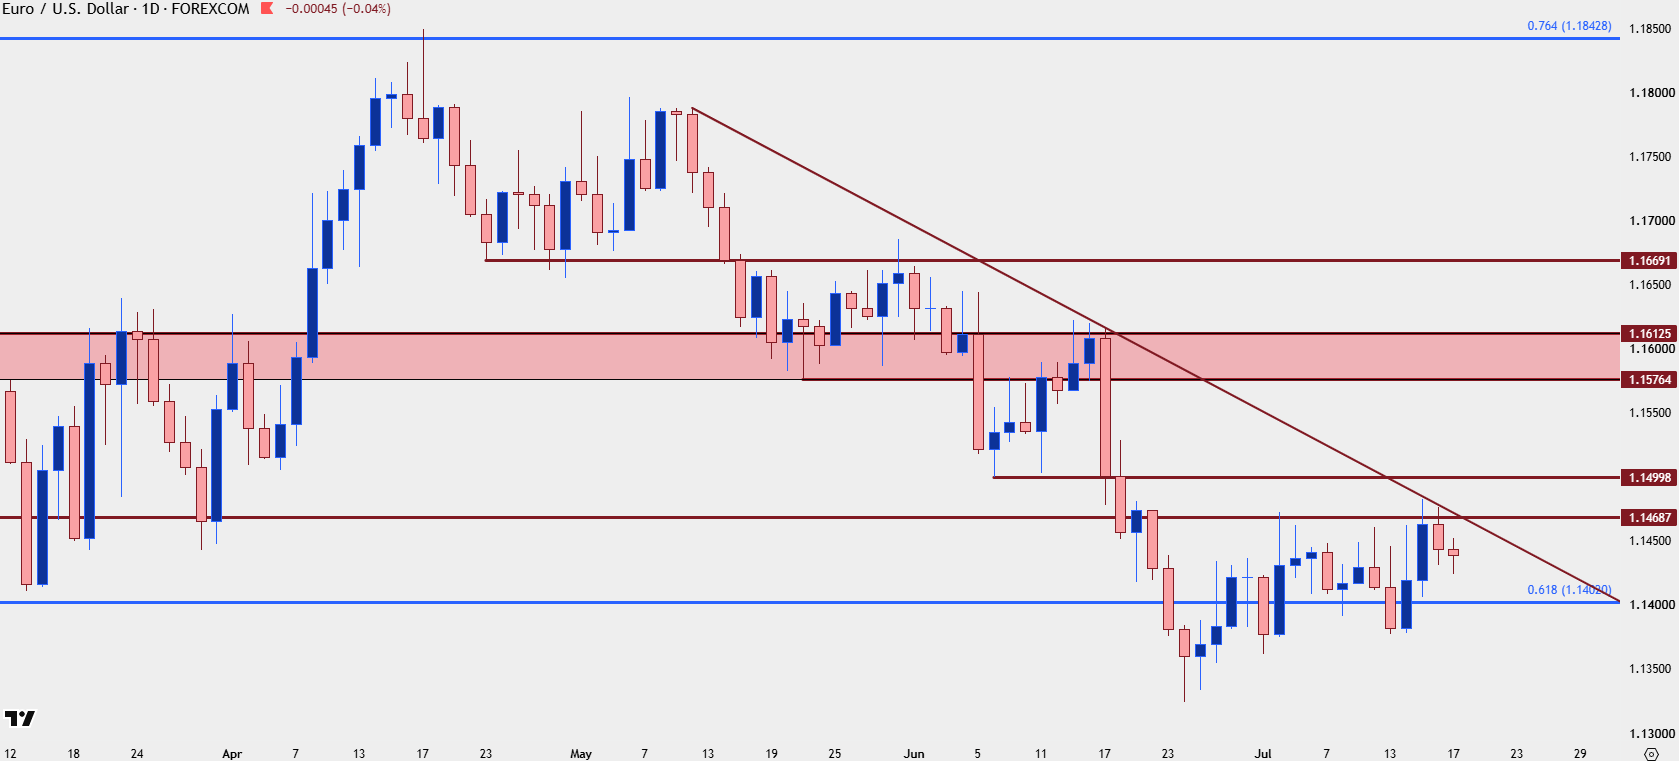
Chart prepared by James Stanley; data derived from Tradingview
GBP/USD
For USD-weakness, I’m still in favor of GBP/USD and the pair put in another fresh high this week even as the USD held support at prior resistance. For next week, it’s UK CPI on Wednesday that’s the big focal point and I had looked into the pair in the Wednesday article, with GBP/USD having since held support at the ‘s1’ area on the chart, around 1.3450.
Deeper support remains around the 1.3390 Fibonacci level up to the 1.3400 zone, and then the 1.3325 level is the ‘s3’ and if bulls can’t hold prices above that, then USD-strength has probably taken over and the breakout USD/JPY would be a more attractive venue to track that theme, in my opinion.
GBP/USD Daily Price Chart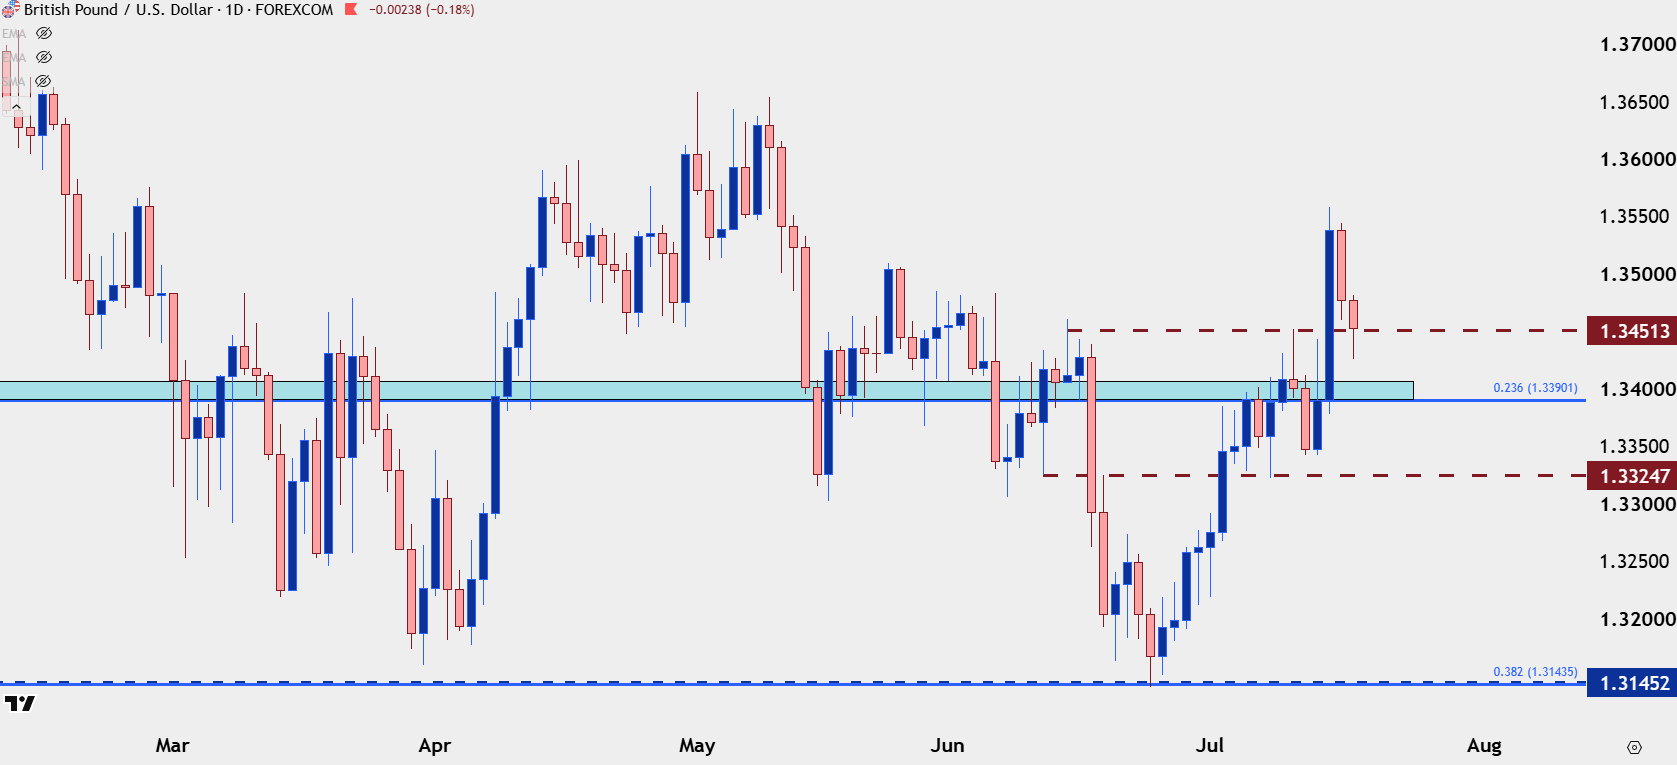
Chart prepared by James Stanley; data derived from Tradingview
--- written by James Stanley, Senior Market Analyst, Global Macro
Latest market news




The complete CFD trading experience
Award-winning platforms, competitive spreads, low commissions and dedicated support.
We live and breathe the markets and are dedicated to helping traders realise their ambitions as we continue to set the industry bar.
Economic calendar
Web Trader platform
Our sophisticated web-based platform is packed with features.
Related articles
GBP/USD Forecast: BoE Caution Leaves the Pound Searching for Direction
Although GBP/USD has gained close to 0.5% over the last three trading sessions, reflecting a period of relative strength for the British pound, today's session has started to show a more neutral tone and the bullish momentum seen earlier in the week has begun to slow.

NFP Preview: New Government, Same Jobs Market?
Traders are still sifting through the fallout of the US midterm elections, just in time to get hit with another volatility: The monthly Non-Farm Payrolls (NFP) report - what will the jobs report show, and what could it mean for the US dollar?


US Dollar Technical Outlook: DXY Bulls Fight to Hold Critical Support Ahead of NFP 11 5 2026
DXY bulls are attempting to defend a pivotal technical threshold, with the next reaction likely to determine whether the broader recovery survives.

StoneX Europe Ltd may make third party material available on this website which may contain information included but not limited to the conditions of financial markets. The material is for information purposes only and does not contain, and should not be construed as containing, investment advice and/or investment recommendation and/or an investment research and/or an offer of or solicitation for any transactions in financial instruments; any decision to enter into a specific transaction shall be made by the client following an assessment by him/her of their situation.
StoneX Europe Ltd makes no representation or warranty and assumes no liability as to the accuracy or completeness of the information provided, nor any loss arising from any investment based on a recommendation, forecast or other information supplied. You should always seek independent advice as to your suitability to speculate in any related markets and your ability to assume the associated risks, if you are at all unsure. We are not under any obligation to update any such material. Any opinion made may be personal to the author and may not reflect the opinion of StoneX Europe Ltd.