










USD/CAD in the crossfire of US CPI and BOC, AUD/CAD wobbles ~ 91c
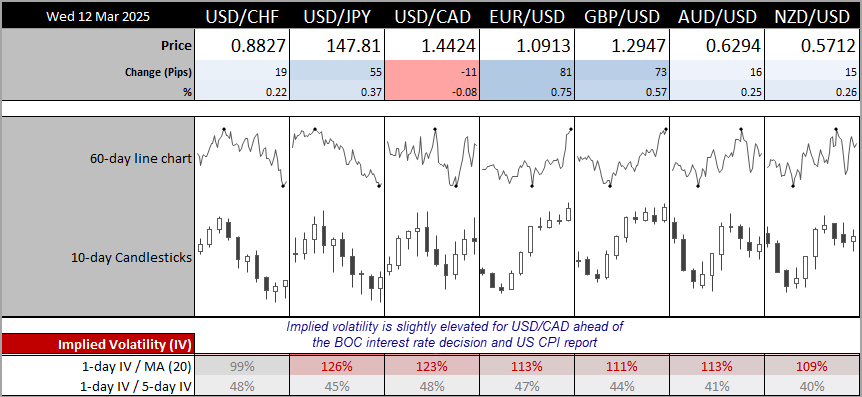
Implied volatility for USD/CAD is slightly elevated over the next 24-hours, due to a Bank of Canada (BOC) rate decision and CPI figures from the US. But it could have been higher were it not for Canada bowing to Trump's threats over tariffs.
Share this:

View related analysis:
View related analysis:
To think it was only three weeks ago that the S&P 500 sat at a record high, seemingly without a care in the world. Yet by Tuesday’s low, it had fallen 10% from its all-time high, as the reality of Trump’s tariffs and investors' concerns over the impact on the US economy begin to bite. And unless it can recover this week’s -3.4% decline, the S&P 500 is on track for its first 4-week decline in 18 months.
Trump has now threatened to double his planned tariffs on steel and aluminium imports from Canada from 25% to 50%, in response to Canada announcing their own retaliatory 25% levy on electricity exports to the US. You can hardly call it ‘tit-for-tat’ with such chunky numbers, and it is seeing investors shy away from risk. The Nasdaq 100 has officially entered a technical correction, having fallen -12.6% from its record high. But it is also fanning fears of a global slowdown, with the DAX currently down 3% this week and the ASX 200 now down -9.4% from its record high.
While this saw USD/CAD spike to 1.45, the move was short-lived and quickly reversed. All thanks to Ontario’s Premier announcing that he will freeze the electricity tariff and fly to Washington for talks. Even if the talks are constructive, the losses on Wall Street over the past four weeks show investors are genuinely concerned for growth in the US and calls for Fed cuts have now seen the US dollar fall to a 4-month low.
Economic events in focus (AEDT)
- 08:45 – New Zealand retail sales
- 10:50 – Japanese PPI, large manufacturing conditions
- 23:30 – US core CPI, real earnings
- 00:30 – BOC interest rate decision (-25bp expected)
USD/CAD implied volatility slightly elevated ahead of BOC, US inflation
The 1-day implied volatility level for USD/CAD is slightly elevated, at 123% compared to its 20-day average. And I would expect it to be higher were Ontario’s Premier not in ’fix it’ mode with Trump. But it is worth noting that the 1-day is also above the 1-week, which shows a level of nervousness in the air among options traders for the Canadian dollar.
The Bank of Canada (BOC) are expected to cut their cash rate by 25bp down to 2.75%, which would also mark their seventh cut of the cycle at as many back-to-back meetings. But it is with no guarantee it will be a dovish cut, based on remarks from Governor Macklem in February 21.
While tariffs are expected to “all but wipe out growth in the economy” in 2025 and 2026, the central bank would also expect higher prices. And that could force the BOC to slow their pace of cuts, while they navigate the tricky scenario of supporting demand while tyring to curb inflationary expectations. And with ex-BOC governor Mark Carney now Canada’s PM and already rolling out counter tariffs, the trade war could just be heating up. And that muddy the messaging from the BOC at this meeting and lower expectations for further cuts and strengthen the Canadian dollar.
US inflation is expected to have eased slightly in February, but that may be a small victory given estimates remain above CPI’s long-term averages. US inflation is expected to have slowed to 0.3% m/m from 0.5% in January, or 2.9% y/y compared to 3% prior. Core CPI is forecast to slow to 0.3% m/m, down from 0.4% prior, or 3.2% y/y compared with 3.3% previously. With leading indicators pointing to slower growth and higher prices, the risk in today’s figures could be that they remain unchanged or worse, higher.
USD/CAD technical analysis
1.45 has been a tough nut for USD/CAD to crack in recent times, with three failed daily closed above it over the past seven days. A wide-legged gravestone doji formed on Tuesday which also closed beneath the monthly pivot point and 1.45 handle. Will it be followed by bearish range expansion, like we saw following last Monday’s doji. Perhaps, but there is also the potential for another high before any leg lower.
The 4-hour chart shows a rising channel, and while it displays a large bearish candle below 1.45, its volume is quite low compared to the large bullish range expansion candle beforehand. And that suggests bulls remain in control, and are already trying to push prices higher as seen on the lower wick.
The bias is to fade into moves towards the cycle highs in anticipation of a false move, before prices roll over. A less-dovish-than expected cut could help, but a bigger driver for USD/CAD weakness could come from a deal being struck over Trump’s tariffs.
AUD/CAD technical analysis
Since the January low set nine weeks ago,
AUD/CAD has recouped half of its losses from the September high to January low over the past nine weeks. Yet price action has been chopping and making hard work of further gains, which suggests the move is corrective and a move lower could be on the cards.
The daily chart shows three failed attempts to close above 91c and the 50% retracement levels, and a bearish pinbar failed to close above the 200-day SMA on Tuesday. With a bearish divergence on the daily RSI (2) and RSI (14), my bias is to fade into moves while prices hold beneath Monday’s pinbar high.
90c makes a viable downside target over the near term, which sits just above the 50-day SMA and weekly VPOC (volume point of control).
View the full economic calendar
View the full economic calendar
-- Written by Matt Simpson
Follow Matt on Twitter @cLeverEdge
How to trade with City Index
You can trade with City Index by following these four easy steps:
- Open an account, or log in if you’re already a customer
• Open an account in the UK
• Open an account in Australia
• Open an account in Singapore
- Search for the market you want to trade in our award-winning platform
- Choose your position and size, and your stop and limit levels
- Place the trade
Related tags:


The complete CFD trading experience
Award-winning platforms, competitive spreads, low commissions and dedicated support.
We live and breathe the markets and are dedicated to helping traders realise their ambitions as we continue to set the industry bar.
Economic calendar
Web Trader platform
Our sophisticated web-based platform is packed with features.
Related articles

Dow Jones Slide Shows What Rate Hike Bets Mean for Stocks
The Dow Jones support breakdown shows rising bond yields and rate hike bets hitting U.S. stocks while tech giants prop up the Nasdaq.

EUR/USD forecast remains tilted lower with French bond troubles ahead of US jobs report
The EUR/USD has tagged a fresh year-to-date low as French public-finance concerns trigger a government bond sell-off. Today's US jobs report may change little, with resilient activity, elevated energy prices and hawkish Fed bets keeping the greenback supported. With the pair trapped below resistance at 1.1410, the risk to the near-term EUR/USD forecast is tilted to the downside.

USD/CAD shooting star puts September surge on notice
USD/CAD has printed a clear bearish reversal pattern after an extraordinary September surge, but confirmation may depend heavily on how US Treasury yields react to Friday’s payrolls report.

StoneX Europe Ltd may make third party material available on this website which may contain information included but not limited to the conditions of financial markets. The material is for information purposes only and does not contain, and should not be construed as containing, investment advice and/or investment recommendation and/or an investment research and/or an offer of or solicitation for any transactions in financial instruments; any decision to enter into a specific transaction shall be made by the client following an assessment by him/her of their situation.
StoneX Europe Ltd makes no representation or warranty and assumes no liability as to the accuracy or completeness of the information provided, nor any loss arising from any investment based on a recommendation, forecast or other information supplied. You should always seek independent advice as to your suitability to speculate in any related markets and your ability to assume the associated risks, if you are at all unsure. We are not under any obligation to update any such material. Any opinion made may be personal to the author and may not reflect the opinion of StoneX Europe Ltd.