




USD/CAD Technical Outlook: Bearish Break Looms as Powell Risks Rise
USD/CAD risks fresh cycle lows as BOC hold bets grow and Fed independence comes under pressure amid Trump’s attacks and rising inflation expectations.
Share this:

I highlighted the importance of the 2021 trendline on USD/CAD back in May, where I warned of an eventual breakdown beneath it. While this has since been achieved, bears have made hard work of pushing USD/CAD materially lower. Though I suspect we could be very close to breaking to fresh cycle lows and continuing its bearish trend that began in February, when Trump originally paused tariffs.
View related analysis:
View related analysis:
Canadian Dollar Outlook: BOC Policy and Fed Risk Support CAD
The US dollar is facing a fresh wave of selling pressure, with traders questioning Fed independence and betting that Trump will indeed oust Federal Reserve (Fed) chair Jerome Powell. This builds the case for the Fed to cut sooner than later.
Meanwhile, odds of Bank of Canada (BOC) cuts are diminishing, with a broad range inflationary indicators heating up and a recent business sentiment survey suggesting concerns of a recession in Canada are receding. The BOC have already cut seven times this cycle for a total of -225bp from 5% to 2.75%. While they could potentially cut again on July 30, the case of them to hold is growing. Especially now trimmed mean CPI is risen to the top of the BOC’s 1-3% target band.
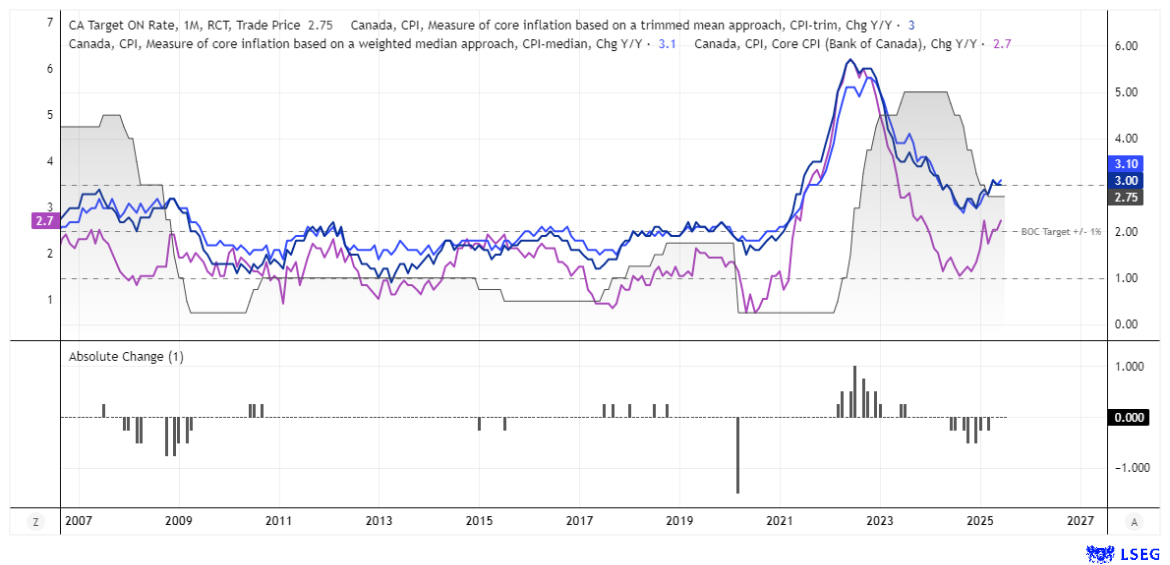
Chart prepared by Matt Simpson – Data source: Bank of Canada (BOC), London Stock Exchange Group (LSEG).
Canadian Dollar Market Positioning – COT Report
Net-short exposure to Canadian dollar (CAD) futures rose to a 6-week high of 74.1k contracts among large speculators last week. Including asset managers, net-short positioning increased by -10.6k contracts. While this leans bearish for the Canadian dollar in the near term, it’s worth noting that net-short exposure has been trending lower since peaking in August 2024.
And as I suspect the Bank of Canada (BOC) is closer to its terminal rate than the Federal Reserve, the potential remains for the Canadian dollar to strengthen further against the US dollar (USD) over the coming weeks, particularly if bearish traders continue unwinding short positions.
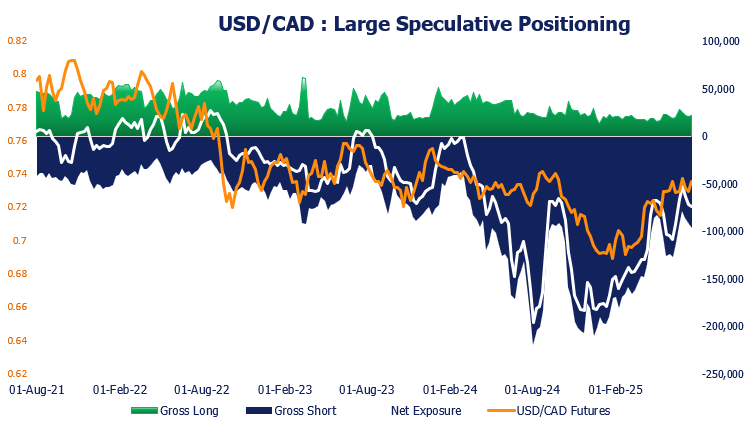
Chart prepared by Matt Simpson – Data Source: CME, LSEG
USD/CAD Technical Analysis: US Dollar vs Canadian Dollar
The weekly chart shows that USD/CAD has been in a sideways consolidation for a couple of months, though momentum has turned briskly lower over the past two days. It failed to break back above the broken 2021 trendline, which has effectively acted as a resistance barrier throughout the consolidation phase.
Notably, the weekly open and close prices have hugged the high-volume node (HVN) from the multi-month range, marking it as a key support zone. A clean break below this level opens the door to a retest of the September low, which also aligns with the 50% Fibonacci retracement from the 2021 low to the 2025 high.
Should prices break beneath 1.3420, the July low comes into focus—just above the 61.8% Fibonacci retracement level and 2023 low near 1.3093.
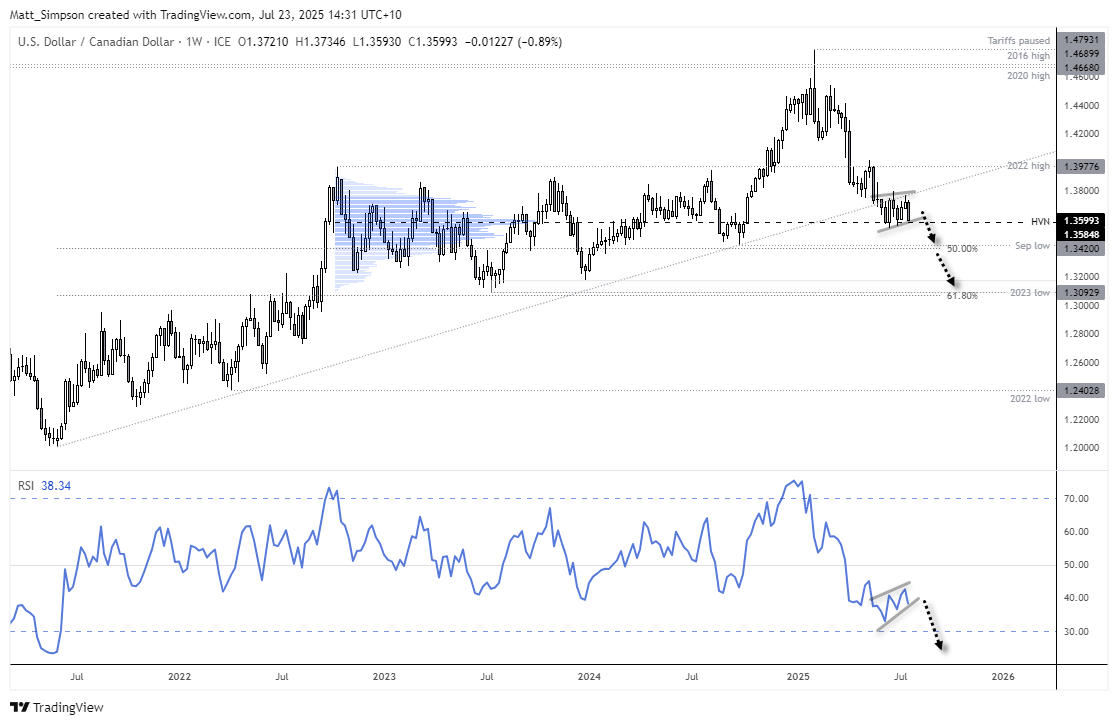
Chart analysis by Matt Simpson - data source: TradingView USD/CAD
View the full economic calendar
View the full economic calendar
-- Written by Matt Simpson
Follow Matt on Twitter @cLeverEdge
How to trade with City Index
You can trade with City Index by following these four easy steps:
- Open an account, or log in if you’re already a customer
• Open an account in the UK
• Open an account in Australia
• Open an account in Singapore
- Search for the market you want to trade in our award-winning platform
- Choose your position and size, and your stop and limit levels
- Place the trade
Related tags:



The complete CFD trading experience
Award-winning platforms, competitive spreads, low commissions and dedicated support.
We live and breathe the markets and are dedicated to helping traders realise their ambitions as we continue to set the industry bar.
Economic calendar
Web Trader platform
Our sophisticated web-based platform is packed with features.
Related articles
Euro Technical Forecast: EUR/USD Snaps Five-Week Slide at Critical Support 10 17 2026
Euro is attempting to regain its footing as stretched momentum raises the stakes for the next move ahead of key PMI data and central bank decisions.

USD/JPY Weekly Outlook: Volatility Has Left the Building
The yen has ignored broad dollar weakness, falling Treasury yields and renewed market turbulence. Yet its relationship with US interest rates remains intact. So why is USD/JPY going absolutely nowhere fast?


Swiss Franc Forecast: USD/CHF Seven-Week Rally Reverses From Yearly Highs 10 16 2026
A sharp rejection from fresh highs has shifted momentum in favor of USD/CHF bears, raising the stakes for a critical support test.
StoneX Europe Ltd may make third party material available on this website which may contain information included but not limited to the conditions of financial markets. The material is for information purposes only and does not contain, and should not be construed as containing, investment advice and/or investment recommendation and/or an investment research and/or an offer of or solicitation for any transactions in financial instruments; any decision to enter into a specific transaction shall be made by the client following an assessment by him/her of their situation.
StoneX Europe Ltd makes no representation or warranty and assumes no liability as to the accuracy or completeness of the information provided, nor any loss arising from any investment based on a recommendation, forecast or other information supplied. You should always seek independent advice as to your suitability to speculate in any related markets and your ability to assume the associated risks, if you are at all unsure. We are not under any obligation to update any such material. Any opinion made may be personal to the author and may not reflect the opinion of StoneX Europe Ltd.