


USD/CHF: Rally loses steam with trendline test looming
After stalling below a key Fib retracement, USD/CHF has slipped back to familiar ground. With no clear momentum signal and limited data ahead, traders may need to watch support levels closely for clues on the next swing.
Share this:

- Monday’s rally unwinds to .8336 breakout zone
- Uptrend intact but increasingly fragile
- Michigan inflation expectations in focus Friday
Summary
Technical levels in USD/CHF have been as precise as a Swiss timepiece this week, with Monday’s bullish breakout stalling at familiar resistance before completing a full roundtrip back to where it began. Rather than being driven by rate differentials or haven demand, recent franc moves have mirrored the yen, euro and pound, suggesting broader US dollar sentiment is steering day-to-day fluctuations.
USD/CHF: Week of Selling Rallies
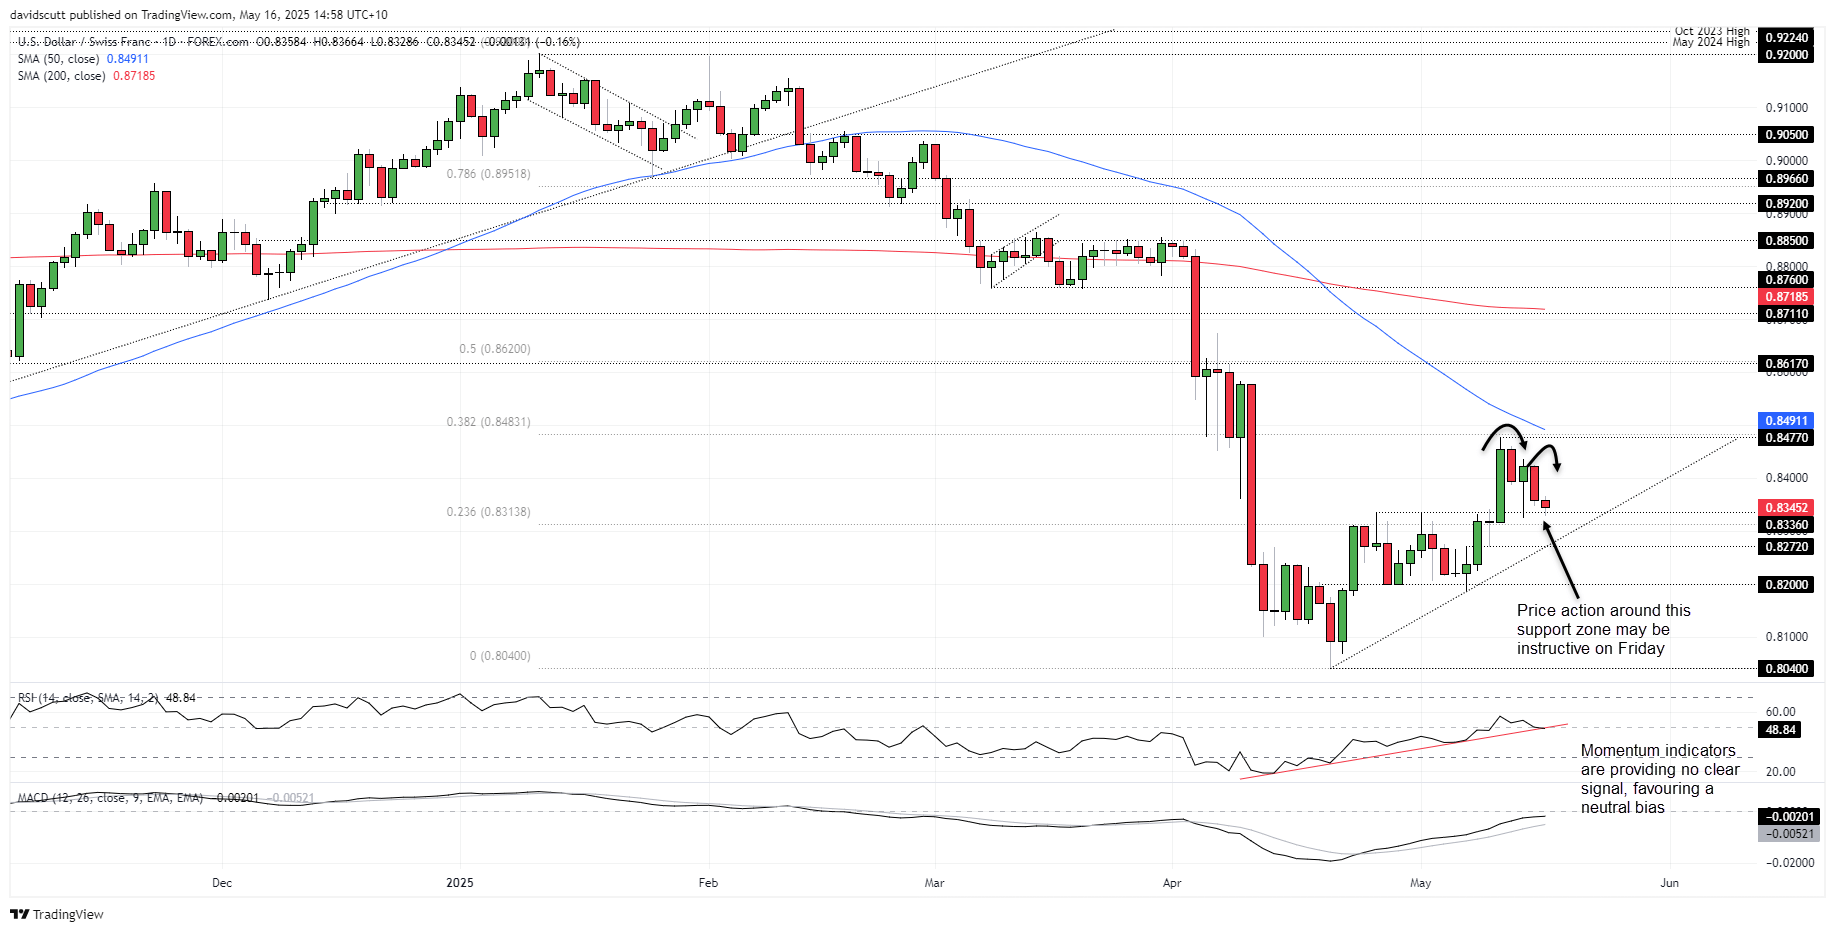
The rally on Monday—sparked by news of a surprise trade deal framework between the US and China—was sharp but short-lived. USD/CHF ran into sellers just below the 38.2% Fib retracement of the 2025 range, before reversing course and bouncing off .8336, the breakout point. That bounce also fizzled, leaving the pair largely unchanged from a week ago.
Source: TradingView
While the broader uptrend from the April 21 low remains intact—set during the peak of the ‘sell America’ trade—this week’s pattern of selling into strength raises the risk the trend may be losing steam. That test may not come today, however, with weekend trade headlines still a potential wildcard for shorts.
On the downside, .8314–36 remains key with horizontal support converging with the 23.6% Fib retracement of the 2025 range. A clean break below would expose .8272, where minor horizontal support intersects with the April 21 uptrend. Below that, .8200 and .8040 emerge as potential bear targets.
Should .8336 continue to hold, upside interest may re-emerge around Wednesday’s high at .8435 and resistance at .8477—levels that may also appeal to fresh shorts.
Momentum indicators are offering few clear cues, with both RSI (14) and MACD looking slightly heavy following a sluggish recovery from oversold extremes hit in late April.
The data calendar is light on Friday with only the University of Michigan’s inflation expectations worth watching. A surprise cooling in the long-run measure could weigh on the dollar if it shifts Fed expectations.
-- Written by David Scutt
Follow David on Twitter @scutty
How to trade with City Index
You can trade with City Index by following these four easy steps:
- Open an account, or log in if you’re already a customer
• Open an account in the UK
• Open an account in Australia
• Open an account in Singapore
- Search for the market you want to trade in our award-winning platform
- Choose your position and size, and your stop and limit levels
- Place the trade
Related tags:


The complete CFD trading experience
Award-winning platforms, competitive spreads, low commissions and dedicated support.
We live and breathe the markets and are dedicated to helping traders realise their ambitions as we continue to set the industry bar.
Economic calendar
Web Trader platform
Our sophisticated web-based platform is packed with features.
Related articles
USD/CAD shooting star puts September surge on notice
USD/CAD has printed a clear bearish reversal pattern after an extraordinary September surge, but confirmation may depend heavily on how US Treasury yields react to Friday’s payrolls report.

USD/MXN Analysis: Is Super Peso Starting to Fade?
Over recent trading sessions, the Mexican peso has continued to show signs of weakness against the U.S. dollar. This can already be seen in USD/MXN, which has gained more than 1.7% over the last three sessions, highlighting sustained buying pressure in favor of the dollar in the short term.


Canadian Dollar Analysis: USD/CAD Returns to July Highs Ahead of NFP
The Canadian dollar continues to face one of its most challenging environments in recent months when it comes to maintaining strength against the U.S. dollar. The weakness of the Canadian currency is clearly reflected in USD/CAD, which has now recorded nine consecutive bullish sessions and gained more than 1.7% during that period.
StoneX Europe Ltd may make third party material available on this website which may contain information included but not limited to the conditions of financial markets. The material is for information purposes only and does not contain, and should not be construed as containing, investment advice and/or investment recommendation and/or an investment research and/or an offer of or solicitation for any transactions in financial instruments; any decision to enter into a specific transaction shall be made by the client following an assessment by him/her of their situation.
StoneX Europe Ltd makes no representation or warranty and assumes no liability as to the accuracy or completeness of the information provided, nor any loss arising from any investment based on a recommendation, forecast or other information supplied. You should always seek independent advice as to your suitability to speculate in any related markets and your ability to assume the associated risks, if you are at all unsure. We are not under any obligation to update any such material. Any opinion made may be personal to the author and may not reflect the opinion of StoneX Europe Ltd.