



USD/JPY and Yen Crosses Analysis: Jobs Revision, Fed Cuts, Technical Outlook
USD/JPY holds steady as NFP revision cuts 911k jobs, Fed cut bets rise, and yen crosses test resistance amid risk-off flows.
Share this:

The US economy created 911k fewer jobs in the 12 months to March, according to the latest Nonfarm Payrolls (NFP) revision. That equates to an average shortfall of 76k jobs per month, reinforcing expectations that the Federal Reserve (Fed) will deliver three consecutive 25bp rate cuts by December. Odds of a further 25bp cut in March have also climbed to 41%.
Yet despite dovish repricing, US Treasury yields and the dollar rose on Tuesday. The move reflects mounting fears that US economic weakness is now spilling over into the global economy. This dynamic also saw the Japanese yen attract safe-haven flows alongside the US dollar, leaving USD/JPY little changed, while other yen crosses such as AUD/JPY and GBP/JPY pulled back more sharply.
View related analysis:
View related analysis:
Yen Crosses Struggle to Hold Momentum
While I suspect the Japanese yen will continue to weaken and drive yen crosses higher, short-term momentum is currently working against the bulls. For now, I’ll be watching whether these pairs can establish swing lows before attempting another bullish breakout.

Chart analysis by Matt Simpson - data source: LSEG
- EUR/JPY printed a bearish engulfing candle on Tuesday, signalling traders are not yet ready to push the cross above the July high, following Monday’s failed attempt.
- GBP/JPY slipped for a second consecutive day, again showing the British pound is not prepared for a sustained breakout above the key 200.00 level.
- CHF/JPY posted a two-bar bearish reversal at the July high, with the Swiss franc effectively ceding its safe-haven role to the yen for the day.
- CAD/JPY also declined, though buyers defended the 200-day SMA. With prices still holding above the August low, the Canadian dollar could mount a rebound against the yen.


Japanese Yen Correlation Analysis: USD/JPY, Nikkei 225, Yields
The positive correlation between USD/JPY, the Nikkei and US–Japan yield differentials has effectively broken down since Trump watered down his own tariffs back in April. From January 2024 through April 2025, the Nikkei and the yield spread consistently tracked USD/JPY higher and lower. Yet today, the Nikkei continues to set record highs while yield differentials collapse and USD/JPY drifts sideways within a well-established range.
This may not be particularly glamorous for USD/JPY traders, but with classic correlations failing to hold, range-trading strategies remain the most suitable approach. In short, sideways action could stay the dominant theme for the US dollar against the Japanese yen.

Chart analysis by Matt Simpson - data source: LSEG
USD/JPY Technical Analysis: US Dollar vs Japanese Yen
The daily chart shows USD/JPY consolidating through most of August and September, bouncing between two weekly VPOCs (volume point of controls) at 146.52 and 148.50. The case for a downside break has weakened after Tuesday’s elongated bullish pinbar, suggesting bulls may be preparing to scoop up discounts near the lower end of the range. Pullbacks towards 147 could therefore attract buyers, targeting 148.00 initially and potentially the highs around 148.50.
Fundamentals are also tilting in favour of yen weakness. The resignation of Japan’s Prime Minister has reduced the likelihood of the Bank of Japan pursuing a rate hike, undermining Japanese yen strength. At the same time, if US economic data continues to soften, the US dollar could still attract safe-haven demand despite increasingly dovish rate expectations. Together, these factors open the door for USD/JPY to break above 149, with 150 becoming the next key upside target.
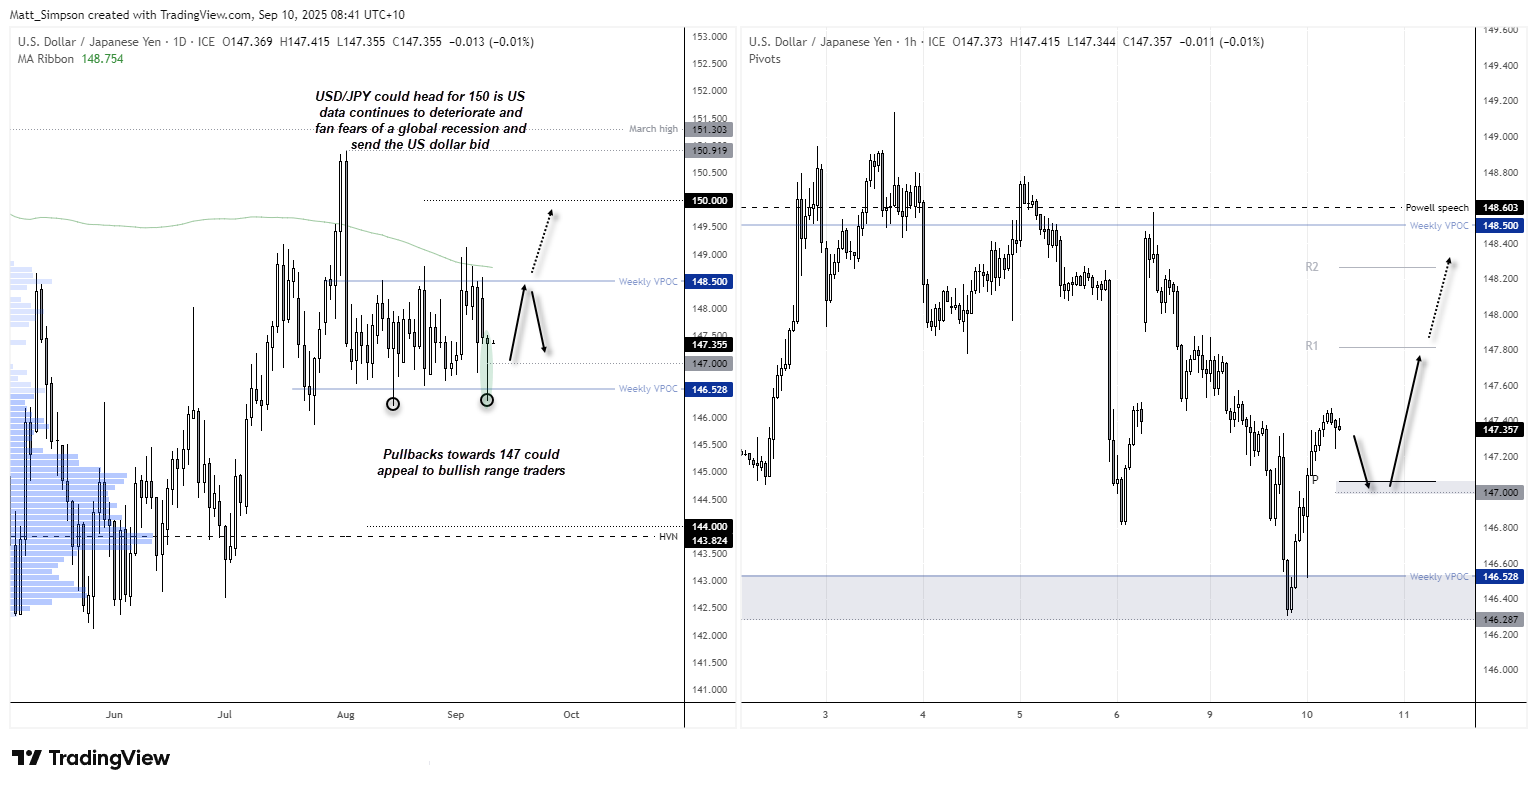
Chart analysis by Matt Simpson - data source: TradingView USD/JPY


AUD/JPY Technical Analysis: Australian Dollar vs Japanese Yen
Like the US dollar, the Australian dollar also held firm against Japanese yen strength on Tuesday, with AUD/JPY seriously eyeing the bullish breakout I warned about last week. Its 10-day rally into resistance – the strongest such run in a decade – highlights bullish intent. The brief two-day pullback further reinforces the underlying strength from buyers.
AUD/JPY now sits comfortably above its 200-day EMA, with the 20- and 50-day EMAs curling higher in a bullish sequence that signals growing near- and medium-term momentum. The 20-day EMA was also defended with a doji and swing low last Friday.
My bias remains bullish while prices hold above 96.30, potentially opening the path to the 99.00 handle, which aligns with the dual highs from January 2025.

Chart analysis by Matt Simpson - data source: TradingView AUD/JPY
Key Economic Events for Traders (AEST / GMT+10)
08:45 NZD External Migration & Visitors, Permanent/Long-Term Migration, Visitor Arrivals (Jul) (NZD/USD, AUD/NZD, NZD/JPY)
11:30 CNY CPI, PPI (Aug) (USD/CNY, AUD/CNY, CN50)
13:35 JPY 5-Year JGB Auction (USD/JPY, EUR/JPY, Nikkei 225)
19:00 EUR Greek CPI, HICP, Industrial Production (Aug/Jul) (EUR/USD, EUR/GBP, EUR/JPY)
20:00 EUR ECOFIN Meetings (EUR/USD, EUR/GBP, DAX)
21:00 USD MBA 30-Year Mortgage Rate, MBA Mortgage Applications, MBA Purchase Index, Mortgage Market Index, Mortgage Refinance Index (S&P 500, Nasdaq 100, USD/JPY)
21:45 CHF SNB Vice Chairman Schlegel Speaks (USD/CHF, EUR/CHF, CHF/JPY)
22:00 EUR German Buba Vice President Buch Speaks (EUR/USD, EUR/GBP, DAX)
22:30 USD Core PPI, PPI, PPI ex. Food/Energy/Transport (Aug) (S&P 500, Nasdaq 100, USD/JPY)
00:00 USD Wholesale Inventories, Wholesale Trade Sales (Jul) (S&P 500, Nasdaq 100, USD/JPY)
00:30 USD Crude Oil Inventories, Refinery Crude Runs, Crude Oil Imports, Cushing Inventories, Distillate Fuel Production, Distillates Stocks, Gasoline Production, Heating Oil Stockpiles, Refinery Utilization Rates, Gasoline Inventories (WTI Crude, Brent Crude, USD/CAD)
01:00 USD Thomson Reuters IPSOS PCSI (Sep) (S&P 500, Nasdaq 100, USD/JPY)
03:00 USD 10-Year Note Auction, Atlanta Fed GDPNow (Q3) (S&P 500, Nasdaq 100, USD/JPY)
Related tags:
Latest market news




The complete CFD trading experience
Award-winning platforms, competitive spreads, low commissions and dedicated support.
We live and breathe the markets and are dedicated to helping traders realise their ambitions as we continue to set the industry bar.
Economic calendar
Web Trader platform
Our sophisticated web-based platform is packed with features.
Related articles
USD/CAD reversal risk builds as central bank showdown looms
USD/CAD has delivered a bullish reversal signal from established support, just as traders prepare for Fed and BoC decisions. Aggressive Canadian rate hike expectations and conflicting momentum signals make the coming session important.
EUR/USD weekly outlook: FOMC and ECB to set the tone
The current backdrop is modestly bearish. On Friday, the EUR/USD closed modestly lower, down for the third consecutive day. The pair also posted a weekly decline after staging a modest recovery attempt in the previous week. Out of the past 8 weeks, the EUR/USD has fallen on 6 occasions. There is not much supporting factors for the single currency right now. So, the upside remains capped.


USD/JPY Forecast: Is Rising Japanese Inflation Supporting the Yen?
As the trading week comes to an end, one of the most relevant developments in the FX market has been the renewed strength of the Japanese yen. This can be seen in the recent performance of USD/JPY, which has fallen nearly 1.0% over the last two trading sessions, highlighting a meaningful recovery in the Japanese currency against the U.S. dollar.

StoneX Europe Ltd may make third party material available on this website which may contain information included but not limited to the conditions of financial markets. The material is for information purposes only and does not contain, and should not be construed as containing, investment advice and/or investment recommendation and/or an investment research and/or an offer of or solicitation for any transactions in financial instruments; any decision to enter into a specific transaction shall be made by the client following an assessment by him/her of their situation.
StoneX Europe Ltd makes no representation or warranty and assumes no liability as to the accuracy or completeness of the information provided, nor any loss arising from any investment based on a recommendation, forecast or other information supplied. You should always seek independent advice as to your suitability to speculate in any related markets and your ability to assume the associated risks, if you are at all unsure. We are not under any obligation to update any such material. Any opinion made may be personal to the author and may not reflect the opinion of StoneX Europe Ltd.