



AUD/JPY Outlook: First 10-Day Rally in 10 Years Faces Resistance
AUD/JPY posts its longest winning streak since 2015, but signs of exhaustion emerge near key resistance.
Share this:

The Australian dollar has posted its longest winning streak against the Japanese yen in a decade, rising for 10 consecutive sessions. The move has been fuelled by resilient Australian macro data and a less dovish Reserve Bank of Australia, in contrast to the Bank of Japan’s firmly dovish tone. Household spending and inflation data continue to support a steady RBA, but with AUD/JPY now testing resistance, traders may be eyeing a potential pullback — or a breakout, if momentum holds.
View related analysis:
View related analysis:
AUD/JPY Nears Key Levels, Household Spending Firms
The Australian dollar has been the strongest performer against the Japanese yen over the past two weeks. While the Bank of Japan (BOJ) continues to lower expectations of a rate hike, Australia’s economic data has surprised to the upside—further delaying expectations of an imminent rate cut by the Reserve Bank of Australia (RBA).
The monthly inflation report came in hotter than expected, with a notable rise in the trimmed mean CPI, suggesting inflationary pressures are not just due to electricity prices. Meanwhile, Q2 GDP was stronger than anticipated, thanks largely to robust domestic demand.
Today’s household spending data further reinforces the narrative of economic resilience. Total household spending rose 5.1% y/y in July, marking its fastest pace since November 2023. Month-on-month, spending was up 0.5%, while services spending climbed 1.6% m/m and 5.9% y/y.
While these levels aren’t historically high, the trend is clearly upward—especially for services. This is not what one would expect from an economy teetering on the edge of recession. Because, clearly, it is not. And that provides more reason for the RBA more reason to hold rates steady into Q4, and possibly into Q1 2026.
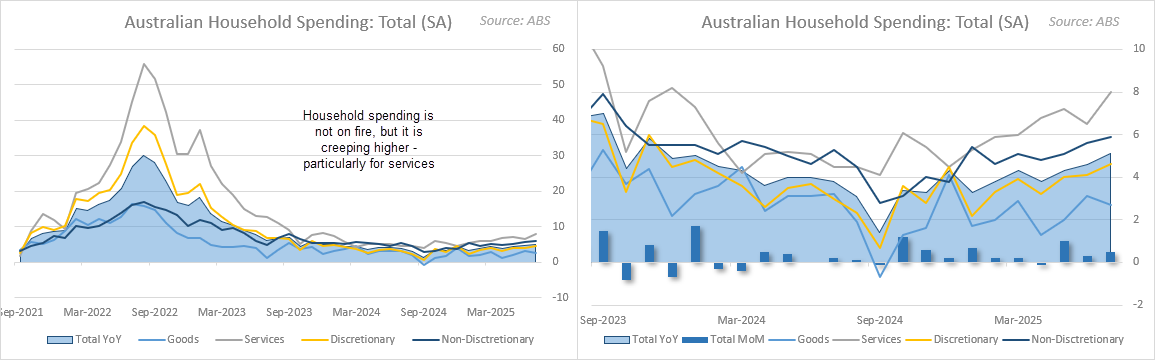
Chart analysis by Matt Simpson - data source: Australian Bureau of Statistics (ABS)
AUD/JPY Technical Analysis: Australian Dollar vs Japanese Yen
Barring a major risk-off event, AUD/JPY looks set to close higher for a second consecutive week. A strong bullish trend has emerged on the weekly chart, and the pair is now challenging the July high, following a relatively shallow retracement to the 23.6% Fibonacci level.
The weekly RSI (14) is confirming the upward move, while the RSI (2) remains below overbought territory—leaving room for further upside momentum. Unless the Bank of Japan (BOJ) unexpectedly turns hawkish or the Reserve Bank of Australia (RBA) adopts a dovish stance, the setup favours a bullish breakout, potentially targeting the 97.43 high.
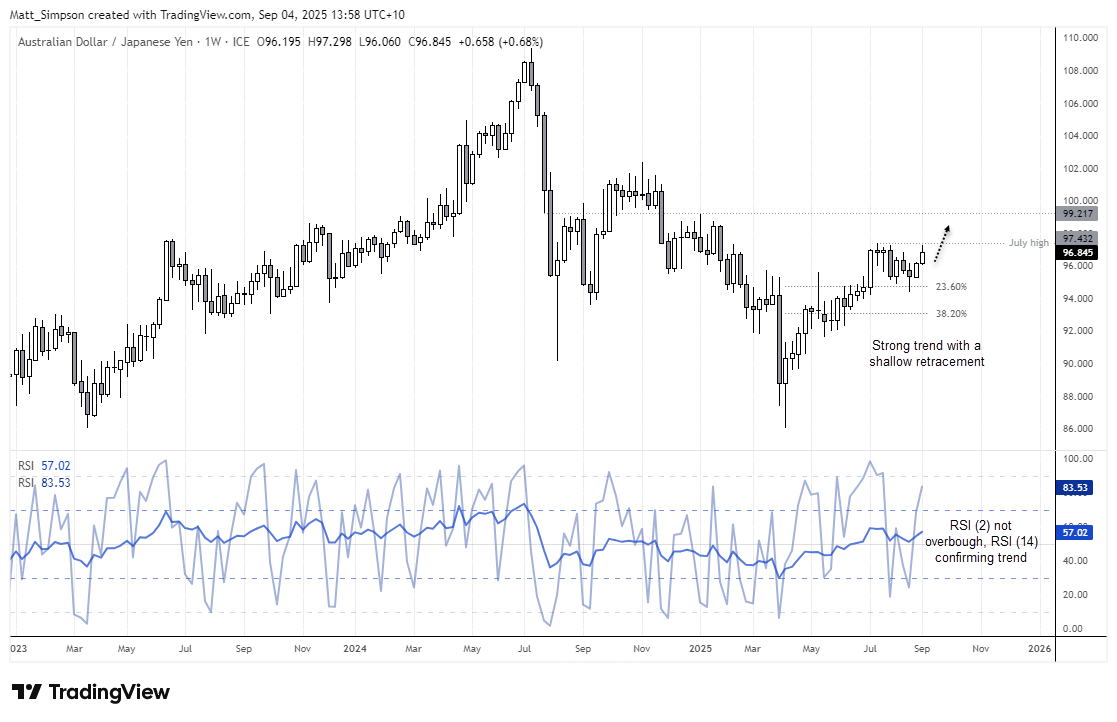
Chart analysis by Matt Simpson – data source: TradingView AUD/JPY
AUD/JPY Technical Analysis: Daily Chart
Bulls may be pushing their luck in the near term. AUD/JPY has now closed higher for 10 consecutive sessions—its longest bullish run since October 2015. While this doesn’t guarantee a strong pullback, the probability of a short-term pause or retracement is growing with each additional up day.
Adding to the caution, a shooting star candle formed on Wednesday, and the daily RSI (2) has remained overbought for two days, now sitting at its highest level since July 2024—which coincided with the top before an 18% decline from 109.30.
With the July high nearby and multiple signs of upside exhaustion, bulls may prefer to wait for a pullback to seek dip-buying opportunities. Alternatively, a breakout above resistance could provide the setup to see whether former resistance turns into support.
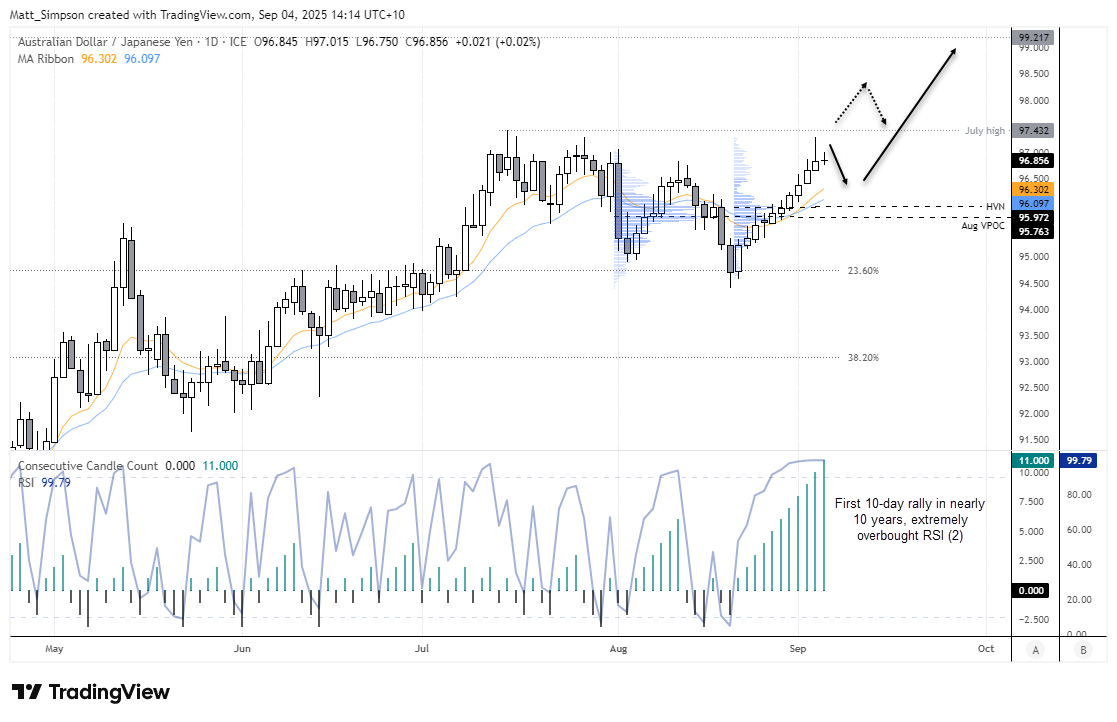
Chart analysis by Matt Simpson - data source: Australian Bureau of Statistics (ABS)
View the full economic calendar
View the full economic calendar
-- Written by Matt Simpson
Follow Matt on Twitter @cLeverEdge
How to trade with City Index
You can trade with City Index by following these four easy steps:
- Open an account, or log in if you’re already a customer
• Open an account in the UK
• Open an account in Australia
• Open an account in Singapore
- Search for the market you want to trade in our award-winning platform
- Choose your position and size, and your stop and limit levels
- Place the trade
Related tags:
Latest market news




The complete CFD trading experience
Award-winning platforms, competitive spreads, low commissions and dedicated support.
We live and breathe the markets and are dedicated to helping traders realise their ambitions as we continue to set the industry bar.
Economic calendar
Web Trader platform
Our sophisticated web-based platform is packed with features.
Related articles
USD/CAD reversal risk builds as central bank showdown looms
USD/CAD has delivered a bullish reversal signal from established support, just as traders prepare for Fed and BoC decisions. Aggressive Canadian rate hike expectations and conflicting momentum signals make the coming session important.
EUR/USD weekly outlook: FOMC and ECB to set the tone
The current backdrop is modestly bearish. On Friday, the EUR/USD closed modestly lower, down for the third consecutive day. The pair also posted a weekly decline after staging a modest recovery attempt in the previous week. Out of the past 8 weeks, the EUR/USD has fallen on 6 occasions. There is not much supporting factors for the single currency right now. So, the upside remains capped.


USD/JPY Forecast: Is Rising Japanese Inflation Supporting the Yen?
As the trading week comes to an end, one of the most relevant developments in the FX market has been the renewed strength of the Japanese yen. This can be seen in the recent performance of USD/JPY, which has fallen nearly 1.0% over the last two trading sessions, highlighting a meaningful recovery in the Japanese currency against the U.S. dollar.

StoneX Europe Ltd may make third party material available on this website which may contain information included but not limited to the conditions of financial markets. The material is for information purposes only and does not contain, and should not be construed as containing, investment advice and/or investment recommendation and/or an investment research and/or an offer of or solicitation for any transactions in financial instruments; any decision to enter into a specific transaction shall be made by the client following an assessment by him/her of their situation.
StoneX Europe Ltd makes no representation or warranty and assumes no liability as to the accuracy or completeness of the information provided, nor any loss arising from any investment based on a recommendation, forecast or other information supplied. You should always seek independent advice as to your suitability to speculate in any related markets and your ability to assume the associated risks, if you are at all unsure. We are not under any obligation to update any such material. Any opinion made may be personal to the author and may not reflect the opinion of StoneX Europe Ltd.