




USD/JPY Breakout Slammed After NFP: EUR/JPY, GBP/JPY
USD/JPY has been slammed since the NFP release, but perhaps more disconcerting are the selloffs in EUR/JPY and GBP/JPY.
Share this:

USD/JPY Talking Points:
- JPY weakness has taken a sudden turn after the Friday NFP report, with USD/JPY showing a large reversal but also dropping have been EUR/JPY and GBP/JPY.
- The Bank of Japan meeting brought a wave of Yen-weakness but all of that has been priced-out in GBP/JPY and most of that has been erased in EUR/JPY.
- I’ll be looking at all three of USD/JPY, EUR/JPY and GBP/JPY in tomorrow’s webinar, and you’re welcome to join. Click here to register.
I had highlighted the USD/JPY setup on Thursday after the pair showed a frenetic breakout above the 150.00 handle. As I wrote then, ‘this doesn’t necessarily preclude continuation, but it does highlight danger in chasing an already developed move trading above a major psychological level for the first time since April.’
The NFP report a day later brought a strong reversal of that rally, and so far this week we’ve seen JPY bulls and USD bears continue the move down to the next level of Fibonacci support at 146.95.
Perhaps more interesting is what’s happening elsewhere, as both EUR/JPY and GBP/JPY are seeing JPY-strength continue. These are also venues that have been propped-higher on the back of the carry trade, and both have shown varying forms of bullishness for most of the past four or five months, even as USD/JPY was driving down for that test of 140.00 in April.
USD/JPY
This is the eye of the storm in my opinion and I would still be hesitant to chase breakouts here given the number of traps that have brewed in USD/JPY so far this year. I think the weekly chart is a good place to start as it can illustrate a calming effect for the past couple days of volatility, and there’s been that slow build of higher-lows since the April test of 140.00 in USD/JPY. The resistance at-play last week was huge, as this was all of the 200-day moving average, the 1540.00 handle and the 50% mark of last year’s sell-off, which did a decent job of marking resistance last week at 150.77.
Taking a step back and it’s possible to still be somewhat optimistic here, but buyers will need to step in rather soon or else that optimism can quickly turn sour.
USD/JPY Weekly Chart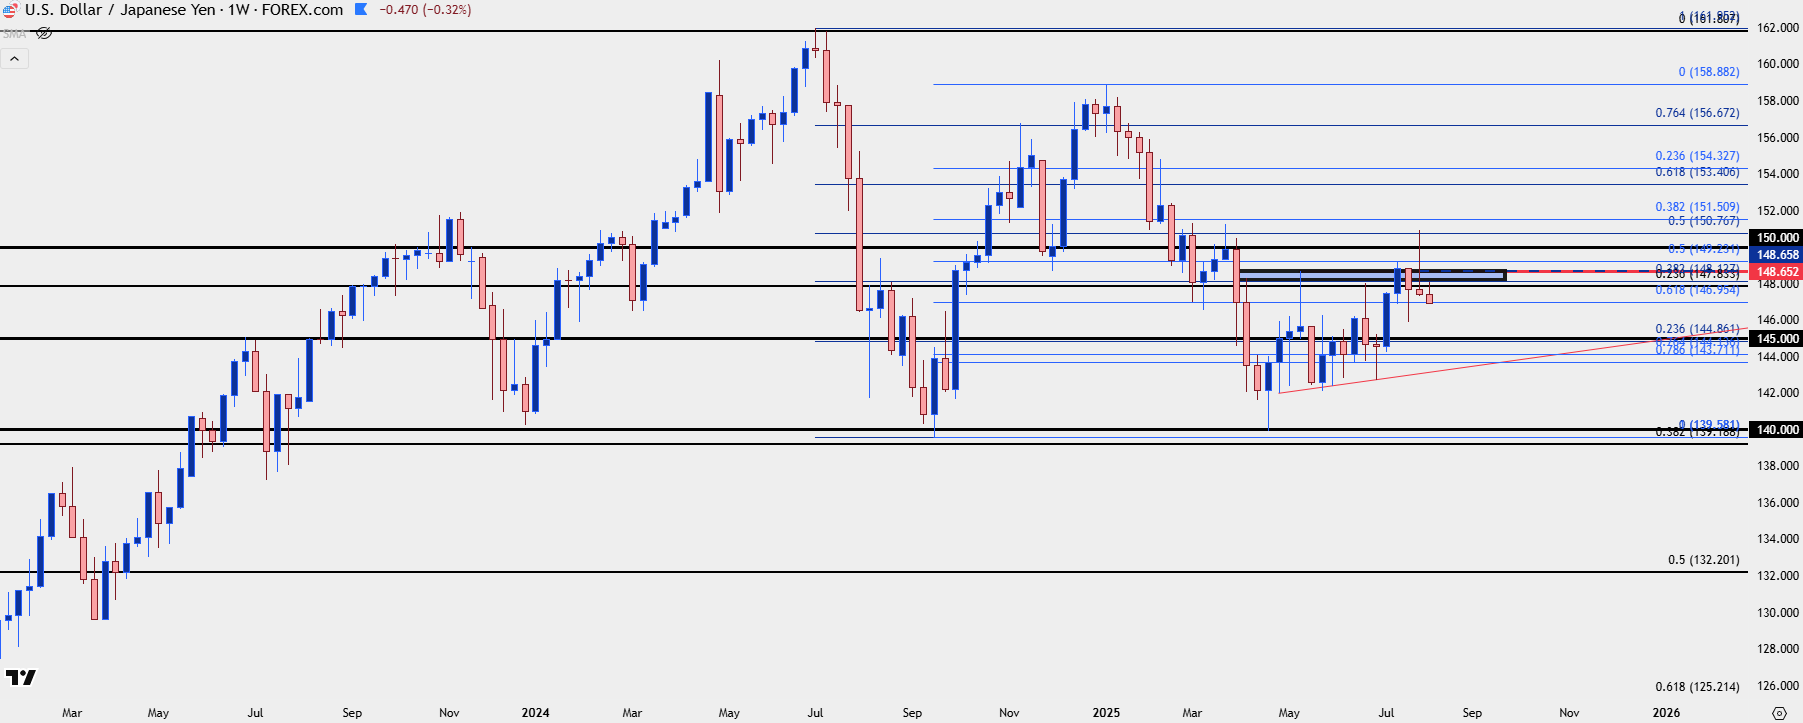
Chart prepared by James Stanley; data derived from Tradingview
USD/JPY Daily Chart
The daily chart can provide additional context given some of the nearby support levels. We already have a Fibonacci level in-place from 146.95 which is the 61.8% retracement of the recovery move from last year’s sell-off. Below that, 145.92 remains big and then below that, 145.00 has been a big spot for USD/JPY even going back to early-Q2.
Overhead, it’s the 148 zone that buyers will ultimately need to battle through to illustrate control in the pair.
USD/JPY Daily Chart
Chart prepared by James Stanley; data derived from Tradingview
EUR/JPY
That USD-weakness on Friday helped EUR/USD to put in a sizable bounce, but that Euro-strength did not show up well in EUR/JPY and the pair has continued to head-lower to start this week.
Last week it was the 170.00 handle that led to a vigorous bounce. As I looked at in the article and webinar, there was lower-high potential, and I was looking at the 172.55 level as a spot of interest for that. Resistance ultimately held at the 61.8% retracement of the sell-off, at 172.30, leading to the most recent wave of weakness.
At this point we have the next test of 170.00. If that holds, and if buyers do show support, it can be argued as a higher-low on a subsequent re-test of the big figure, and that can be construed as bullish. Ideally, the level would hold on a longer-term, such as the daily close. But if bulls can’t hold it – and sellers do slice through last Thursday’s low of 169.73, it’s going to look quite bearish and the door then opens for moves towards 168.57.
EUR/JPY Daily Chart
Chart prepared by James Stanley; data derived from Tradingview
GBP/JPY
While EUR/JPY is testing that 170.00 level which is above last week’s low, GBP/JPY has already fallen to a fresh monthly low and is closing in on its first test of 195.00 since mid-June. Again, chasing is a challenge here as four-hour RSI is already oversold and price is nearing its first re-test of a major psychological level. But, given the context there’s also some resistance potential to work with, such as the 196.38 level or the 197.44 level.
If we do see the breakdown take-hold, the longer-term zone runs down to 193.61 and that can be an element of follow-through support, after which bounces could look to resistance at the 195.00 level as a major test for sellers.
GBP/JPY Daily Price Chart
Chart prepared by James Stanley; data derived from Tradingview
--- written by James Stanley, Senior Strategist



The complete CFD trading experience
Award-winning platforms, competitive spreads, low commissions and dedicated support.
We live and breathe the markets and are dedicated to helping traders realise their ambitions as we continue to set the industry bar.
Economic calendar
Web Trader platform
Our sophisticated web-based platform is packed with features.
Related articles

USD/MXN Analysis: Is Super Peso Starting to Fade?
Over recent trading sessions, the Mexican peso has continued to show signs of weakness against the U.S. dollar. This can already be seen in USD/MXN, which has gained more than 1.7% over the last three sessions, highlighting sustained buying pressure in favor of the dollar in the short term.


Nasdaq 100 Forecast: NDX slips as Treasury yields keep rising
U.S. stocks are falling at the start of Q4, as gains in software stocks offset concerns over soaring Treasury yields. U.S. Treasury yields continue to rise, with the 10-year yield up 2 basis points at 5.31% and the 30-year at 5.66%, multi-decade highs.


US Dollar Technical Outlook: DXY Bulls Meet Resistance at Yearly Highs 10 1 2026
The U.S. Dollar has held firm despite fading Fed hike bets, but Friday’s payrolls could test the rally’s staying power.

StoneX Europe Ltd may make third party material available on this website which may contain information included but not limited to the conditions of financial markets. The material is for information purposes only and does not contain, and should not be construed as containing, investment advice and/or investment recommendation and/or an investment research and/or an offer of or solicitation for any transactions in financial instruments; any decision to enter into a specific transaction shall be made by the client following an assessment by him/her of their situation.
StoneX Europe Ltd makes no representation or warranty and assumes no liability as to the accuracy or completeness of the information provided, nor any loss arising from any investment based on a recommendation, forecast or other information supplied. You should always seek independent advice as to your suitability to speculate in any related markets and your ability to assume the associated risks, if you are at all unsure. We are not under any obligation to update any such material. Any opinion made may be personal to the author and may not reflect the opinion of StoneX Europe Ltd.