







USD/NOK, NOK/JPY: Rate differentials and sentiment skew directional risks
Risk sentiment and rate differentials are dictating directional risks for USD/NOK and NOK/JPY. With weakening ties to US rates and oil, and carry trade flows dominating NOK/JPY, we look at setups as we head toward year-end.
Share this:

- USD/NOK: Weakening correlation with US rates and energy prices, like other commodity currencies
- NOK/JPY: Carry trade flows dominate directional moves
- Bearish bias, but wait for confirmation from price signals
Overview
The re-emergence of the US as a global energy superpower continues to weigh on smaller commodity currencies like the Norwegian krone, limiting upside during periods of higher prices while amplifying downside stemming from bouts of risk aversion and relative interest rate differentials. This dynamic has kept NOK struggling for traction, leaving it on the back foot against a resurgent US dollar.
This note examines the fundamental and technical drivers for USD/NOK and NOK/JPY, highlighting potential trade setups based on available information.
Market drivers shifting?
The strong correlation between USD/NOK and US rates markets has weakened over the past fortnight. There’s been no significant relationship with the shape of the Fed funds curve (a proxy for Fed rate cut pricing), US two or 10-year Treasury yields, or yield spreads between US and Norwegian benchmark bonds.
Source: TradingView
Instead, USD/NOK has shown strong negative correlations with AUD/USD, and a slightly weaker relationships with NZD/USD and USD/ZAR over the same period. Notably, there’s been no significant correlation with crude oil or natural gas futures in the US or Europe, nor with USD/CNH, hinting USD/NOK may be acting as a proxy for the global economic outlook.
USD/NOK rally losing momentum
Source: TradingView
The USD/NOK rally has slowed over the past month, running into sellers above 11.20 on multiple occasions. On the downside, buyers are stepping in near the uptrend established in late September, creating an increasingly narrow range. RSI (14) is trending lower with MACD confirming the bearish momentum signal, suggesting a downside break is more likely in the near term.
For shorts, the preference would be to see a break and close beneath the uptrend before establishing positions, particularly given last week’s false break. Key downside levels include 11.00, 10.96, the 50-day moving average, and 10.8585. Conversely, a break above 11.20 would invalidate the bearish bias.
NOK/JPY tied to yield differentials
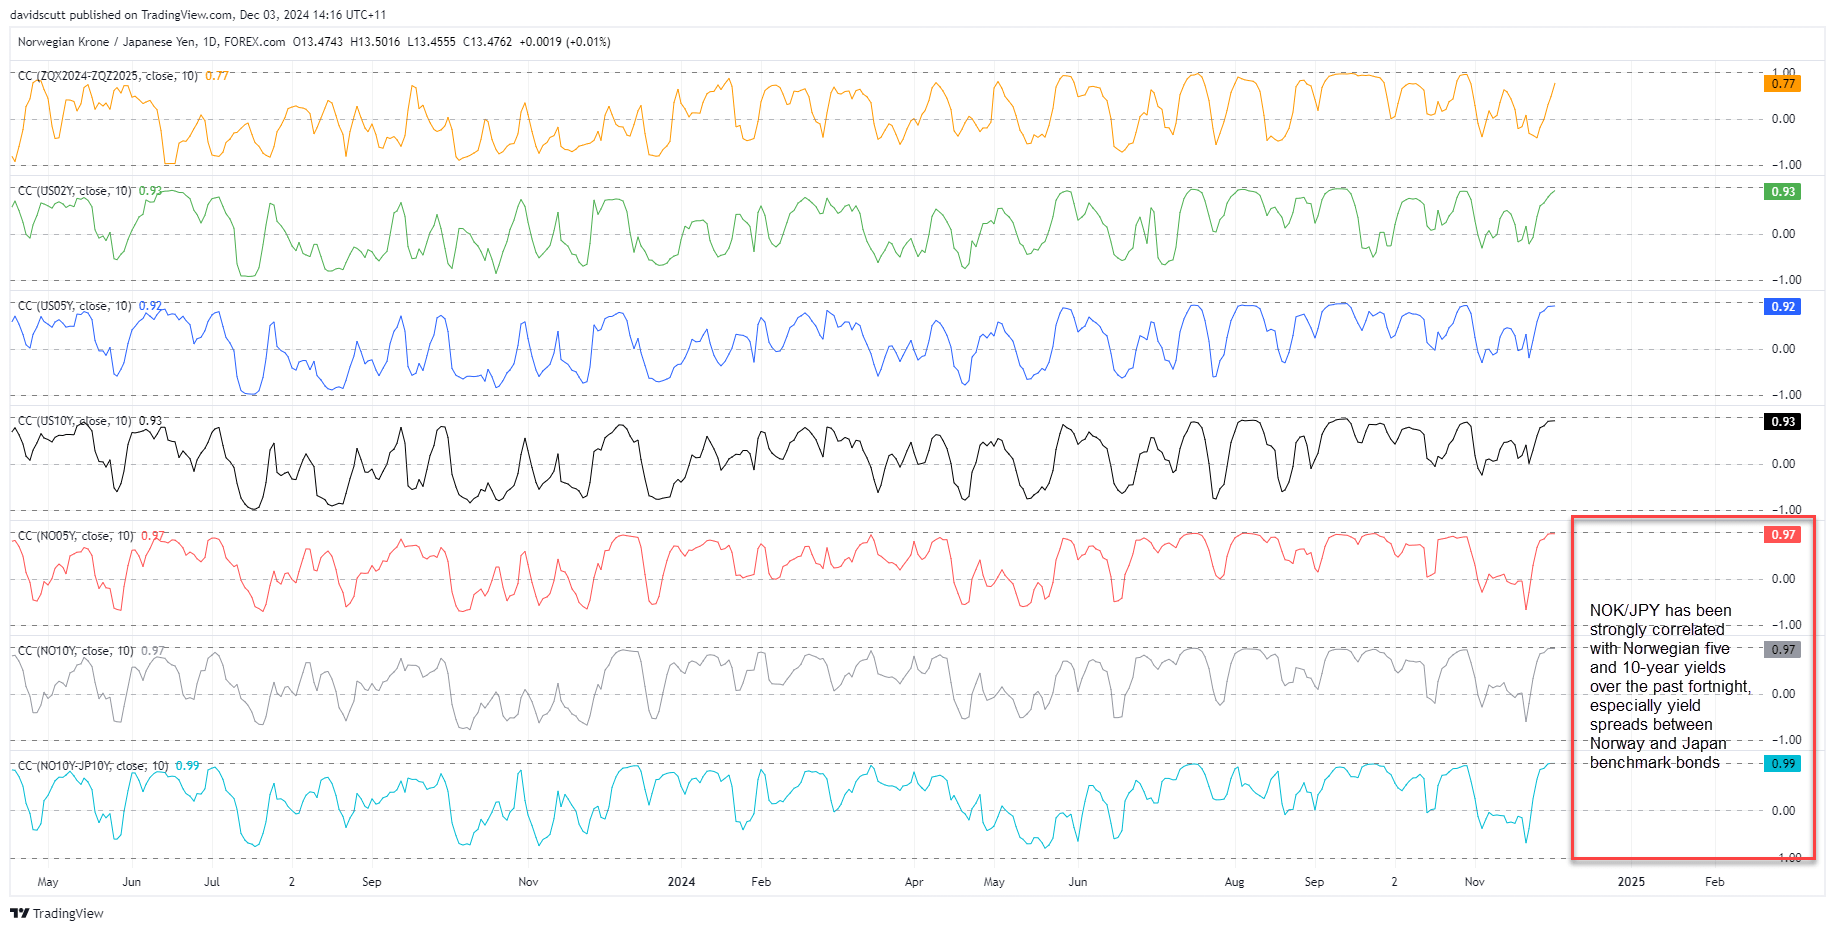
Correlation analysis highlights how influential rates markets have become for NOK/JPY recently, particularly longer-term yield spreads. The correlation coefficient with the 10-year yield differential between Norway and Japan stands at 0.99, a near-perfect relationship. Similar strong correlations have been observed with Norwegian five and 10-year bond yields, underscoring the role of carry trade flows in driving NOK/JPY movements.
Source: TradingView
As for Norway’s interest rate outlook, the implied probability of a rate cut from the Norges Bank on December 19 is negligible with only 3.9bps priced. Looking beyond the turn of the calendar year, a 25bps cut in January is marginally favoured with 15.2bps priced, with the first cut of the cycle fully priced by March where markets see a strong possibility of a 50 being delivered.
Source: Bloomberg
Interpreting what that may mean for Norwegian bond yields further out the curve, the Norwegian 3s-10s curve has traded in a narrow ~25bps range for most of the year, suggesting that movements at the front end of the curve – most influenced by monetary policy – haven’t diverged significantly from longer maturities. It may not remain that way, but it suggests moves in longer-dated yields are not simply a function of global factors but domestic, too.
Source: TradingView
NOK/JPY teeters above uptrend support
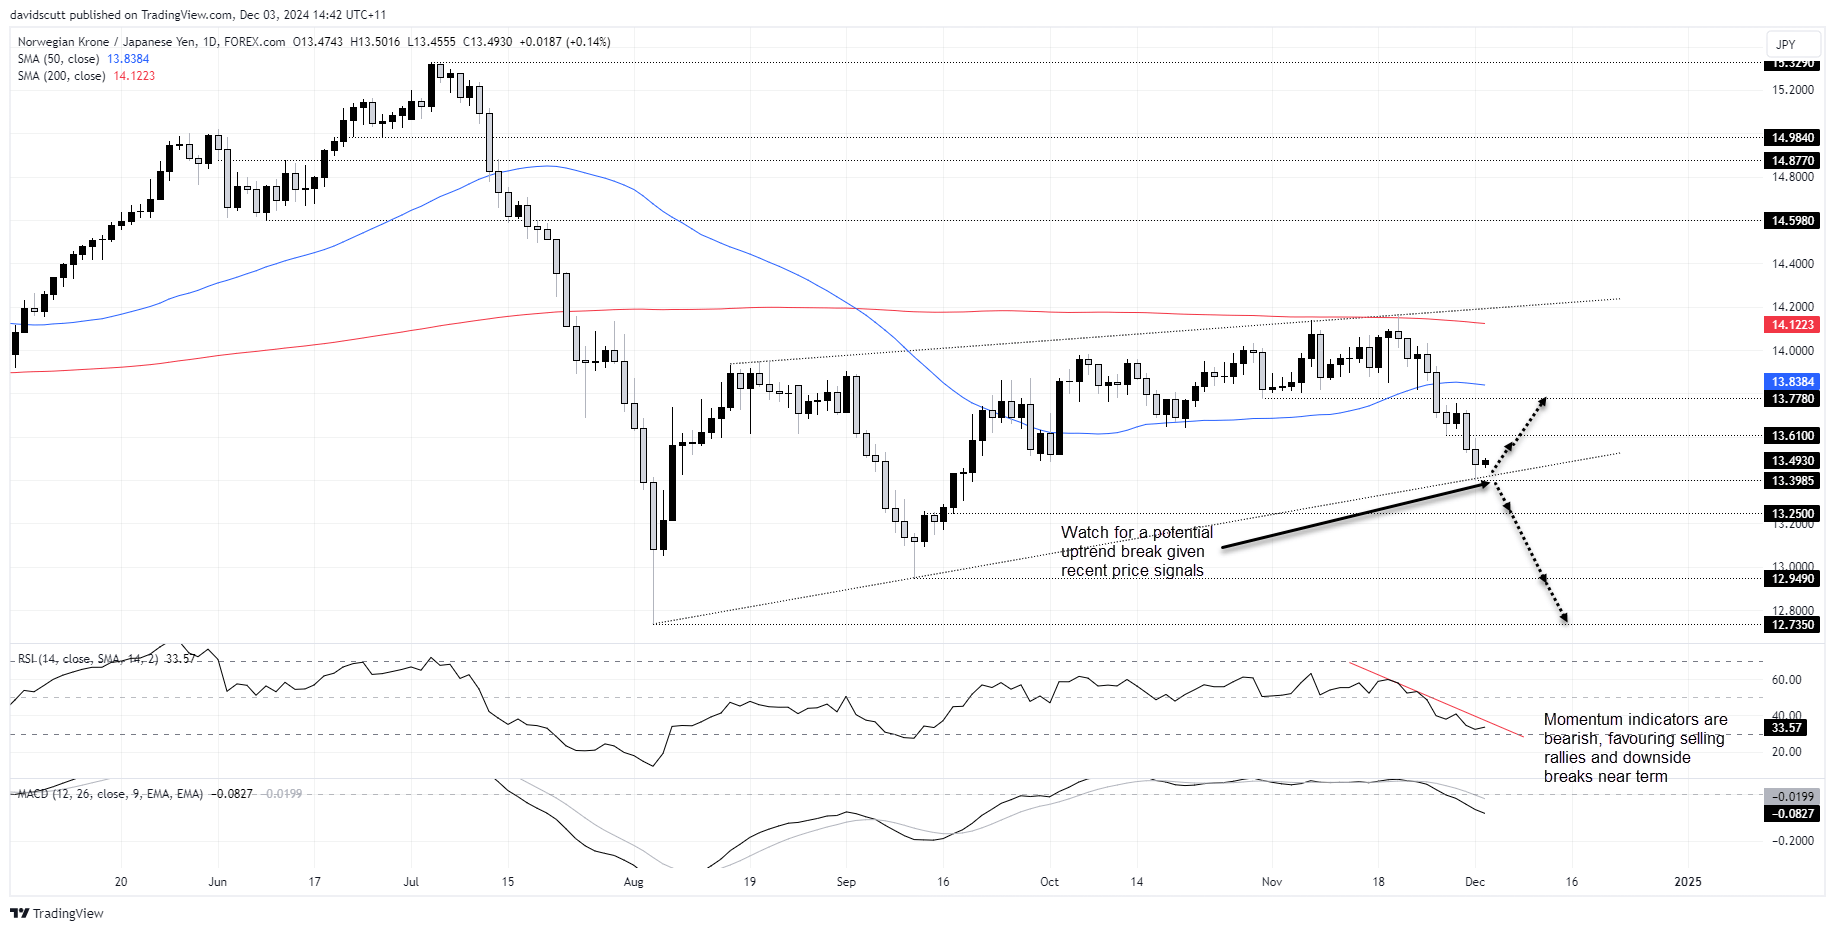
NOK/JPY is trading in a rising wedge on the daily timeframe, grinding higher after a significant bearish move in July and early August.
The price has looked heavy since failing twice at the 200-day moving average in November, slicing through the 50-day moving average and multiple minor horizontal supports before bouncing off uptrend support. RSI (14) and MACD are flashing bearish signals, favouring selling rallies or breaks in the near term.
Source: TradingView
If the price were to break and hold beneath the uptrend, shorts could be established with a tight stop above for protection. On the downside, 13.25, 12.949 and 12.735 are levels to watch, with f the latter two suitable for potential targets.
Alternatively, if the uptrend holds, the setup could be flipped with longs established above with a stop beneath 13.3985 for protection. 13.61 is a minor resistance level overhead, with 13.778, 50-day moving average and 200-day moving average more formidable tests above. Depending on your risk-reward, the latter three screen as suitable targets.
-- Written by David Scutt
Follow David on Twitter @scutty
How to trade with City Index
You can trade with City Index by following these four easy steps:
- Open an account, or log in if you’re already a customer
• Open an account in the UK
• Open an account in Australia
• Open an account in Singapore
- Search for the market you want to trade in our award-winning platform
- Choose your position and size, and your stop and limit levels
- Place the trade
Related tags:
Latest market news




The complete CFD trading experience
Award-winning platforms, competitive spreads, low commissions and dedicated support.
We live and breathe the markets and are dedicated to helping traders realise their ambitions as we continue to set the industry bar.
Economic calendar
Web Trader platform
Our sophisticated web-based platform is packed with features.
Related articles
USD/CAD reversal risk builds as central bank showdown looms
USD/CAD has delivered a bullish reversal signal from established support, just as traders prepare for Fed and BoC decisions. Aggressive Canadian rate hike expectations and conflicting momentum signals make the coming session important.
EUR/USD weekly outlook: FOMC and ECB to set the tone
The current backdrop is modestly bearish. On Friday, the EUR/USD closed modestly lower, down for the third consecutive day. The pair also posted a weekly decline after staging a modest recovery attempt in the previous week. Out of the past 8 weeks, the EUR/USD has fallen on 6 occasions. There is not much supporting factors for the single currency right now. So, the upside remains capped.


USD/JPY Forecast: Is Rising Japanese Inflation Supporting the Yen?
As the trading week comes to an end, one of the most relevant developments in the FX market has been the renewed strength of the Japanese yen. This can be seen in the recent performance of USD/JPY, which has fallen nearly 1.0% over the last two trading sessions, highlighting a meaningful recovery in the Japanese currency against the U.S. dollar.

StoneX Europe Ltd may make third party material available on this website which may contain information included but not limited to the conditions of financial markets. The material is for information purposes only and does not contain, and should not be construed as containing, investment advice and/or investment recommendation and/or an investment research and/or an offer of or solicitation for any transactions in financial instruments; any decision to enter into a specific transaction shall be made by the client following an assessment by him/her of their situation.
StoneX Europe Ltd makes no representation or warranty and assumes no liability as to the accuracy or completeness of the information provided, nor any loss arising from any investment based on a recommendation, forecast or other information supplied. You should always seek independent advice as to your suitability to speculate in any related markets and your ability to assume the associated risks, if you are at all unsure. We are not under any obligation to update any such material. Any opinion made may be personal to the author and may not reflect the opinion of StoneX Europe Ltd.