






USD/NOK: Rate cut surprise fades as crude calls the shots
Norges Bank cut earlier than expected, but the krone barely blinked. With USD/NOK still tracking oil and risk sentiment more than rates, geopolitical headlines remain the dominant driver.
Share this:

USD/NOK Summary
Norges Bank caught markets napping with a surprise 25bp cut on Thursday, lowering the sight deposit rate to 4.25%—the first move lower in five years. The krone slumped on the decision, but the move didn’t stick. While rate differentials briefly weighed on USD/NOK, geopolitical risk has been the dominant force.
The pair remains tightly linked to Brent crude and S&P 500 futures, acting as a proxy for Middle East tensions. With headlines driving direction, rallies may be short-lived unless the conflict escalates further.
Norges Bank Blinks, Signals Shallower Easing Cycle
Norges Bank surprised markets on Thursday with a 25bp rate cut to 4.25%—its first in five years—delivering the move earlier than flagged in March and catching most forecasters off guard.
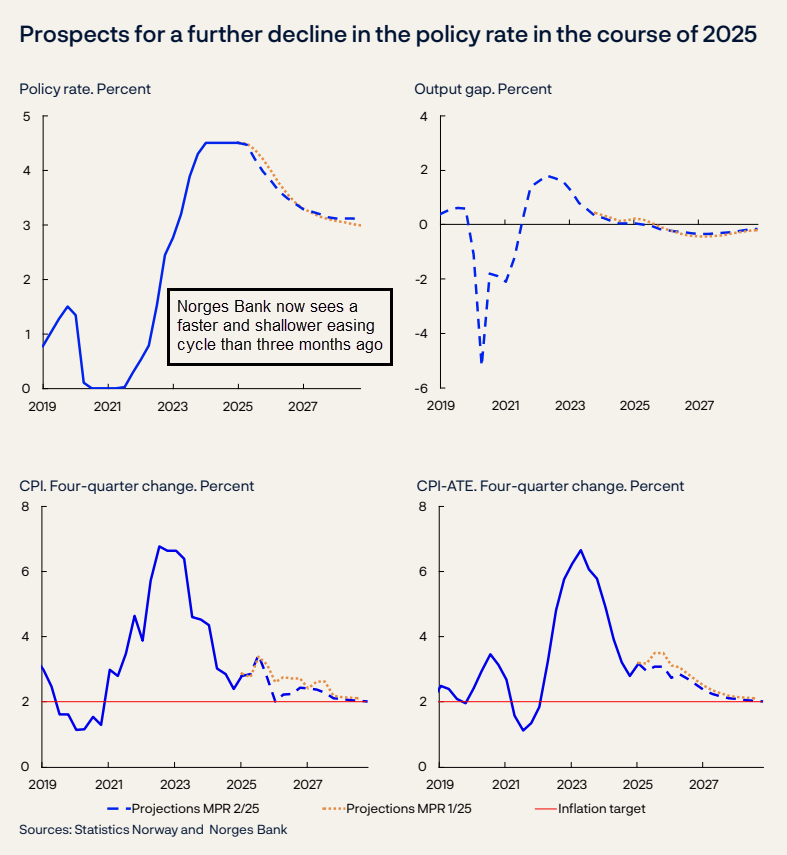
While the timing of the cut came as a surprise, the overall easing path was merely tweaked with the Bank signalling a faster but shallower cutting cycle than three months ago, with the policy rate expected to fall to 3% by the end of 2028—slightly above the level projected in March.
Source: Norges Bank
The decision was driven by softer-than-expected inflation and an improved growth outlook, with policymakers noting the 2% inflation target is now within sight. Still, they kept a cautious tone, warning that fewer cuts will be delivered if wage and price pressures linger.
While the timing caught economists off guard, for currency traders, it was another central bank stepping off the brake while the Fed remains on hold, shifting yield differentials in favour of the greenback. The reaction in markets was swift: the Norwegian krone slumped more than 1% against the US dollar, bond yields tumbled, and traders quickly moved to price in more easing in the back half of the year.
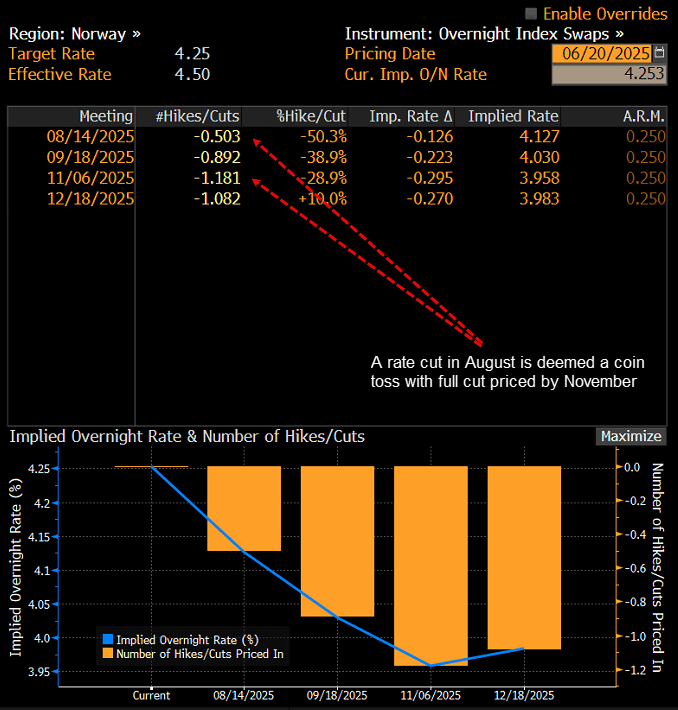
Based on swaps markets, another 25bp rate cut on August 14 is deemed a coin flip, with a move by September 18 priced at 89%. That would leave the policy rate at 4% and points to quarterly reductions over the course of 2026, based on the bank’s own rate track.
Source: Bloomberg
USD/NOK Shifts to Geopolitical Risk Barometer
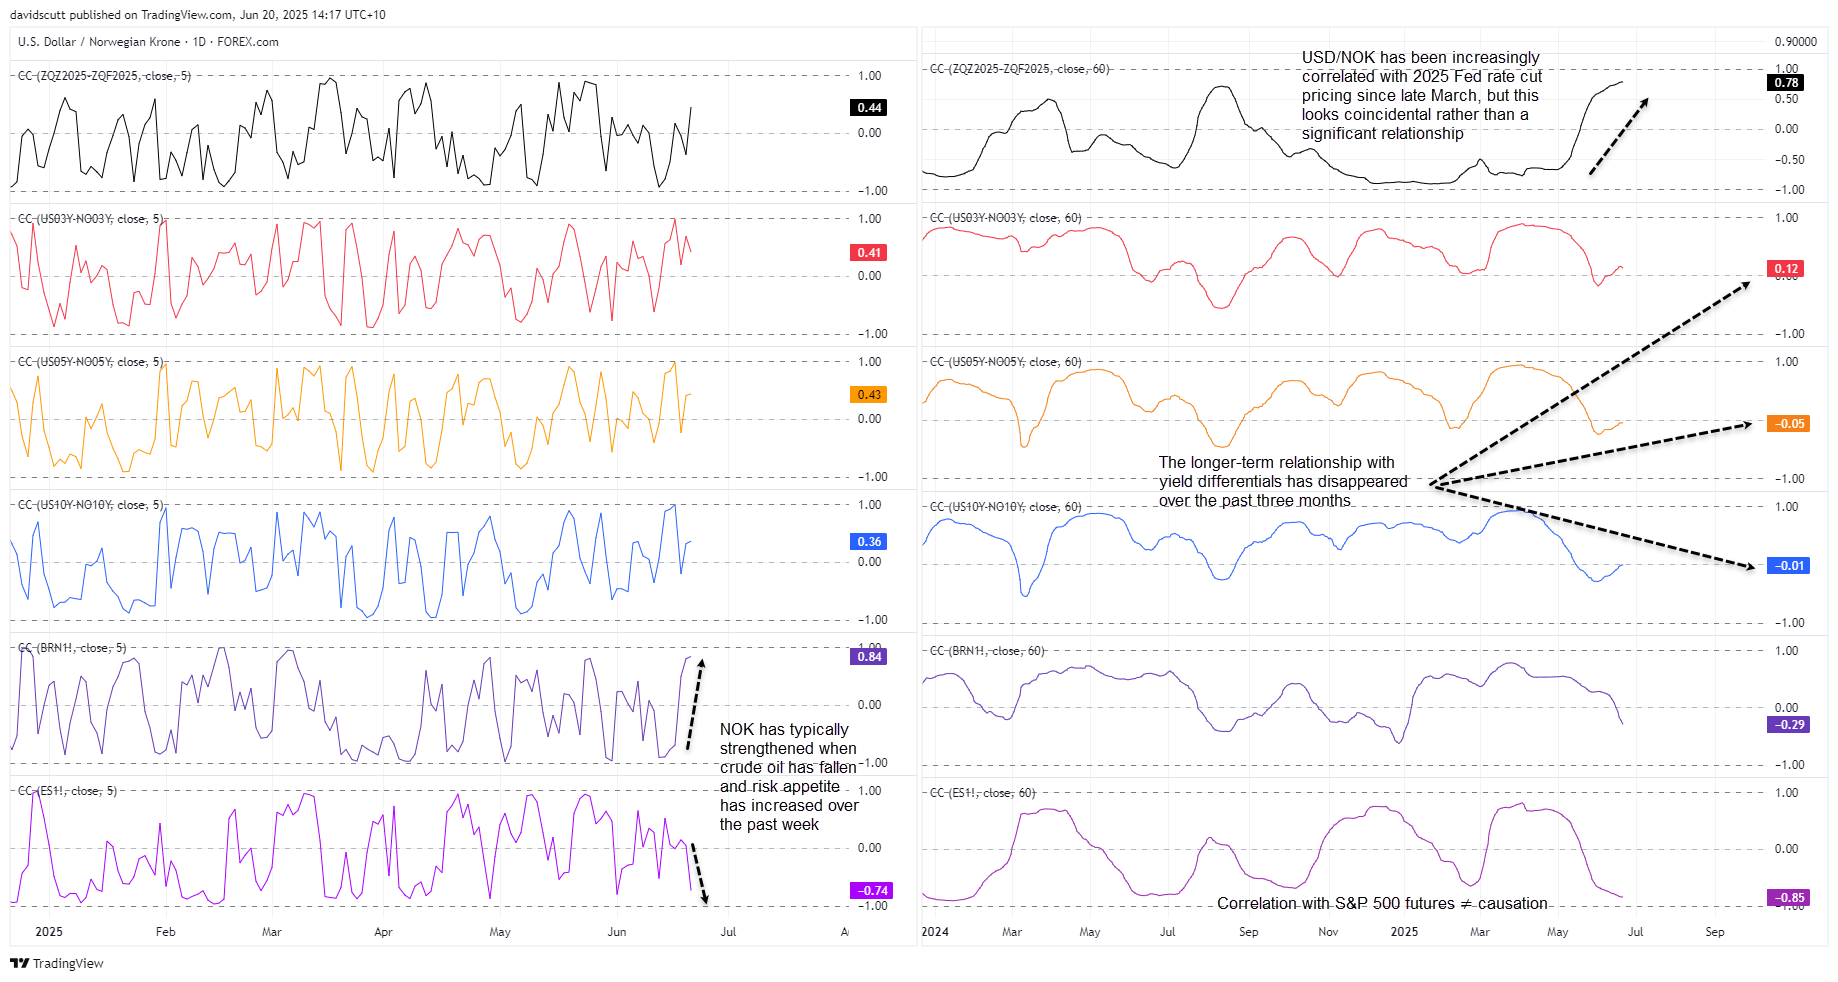
While rate differentials played a key role behind Thursday’s move, over the past week, USD/NOK has been more a play on geopolitical risk, demonstrating a strong relationship with brent crude futures. It has also seen a mildly strong inverse relationship with S&P 500 futures over the same period. Despite being an energy superpower like the United States, like so many other currencies against the USD this week, it suggests the NOK has just been a barometer on Middle Eastern geopolitical risk, strengthening when crude prices have fallen and weakening when they rally.
Zooming out, it’s noteworthy that over the medium-term, the mildly positive correlation often seen between USD/NOK and U.S.-Norwegian yield spreads has disintegrated since Donald Trump’s ‘Liberation Day’ tariff announcement in early April.
Source: TradingView
With the krone likely to remain a geopolitical risk barometer for up to a fortnight until Donald Trump decides whether the U.S. should enter the conflict between Iran and Israel directly, it points to headline risk being the primary driver for USD/NOK next week. Bolstering that view, the pop in USD/NOK following the Norges Bank decision has now been largely reversed, coinciding with a more than 2% drop in brent futures on Friday.
USD/NOK: Selling Pops Preferred
Source: TradingView
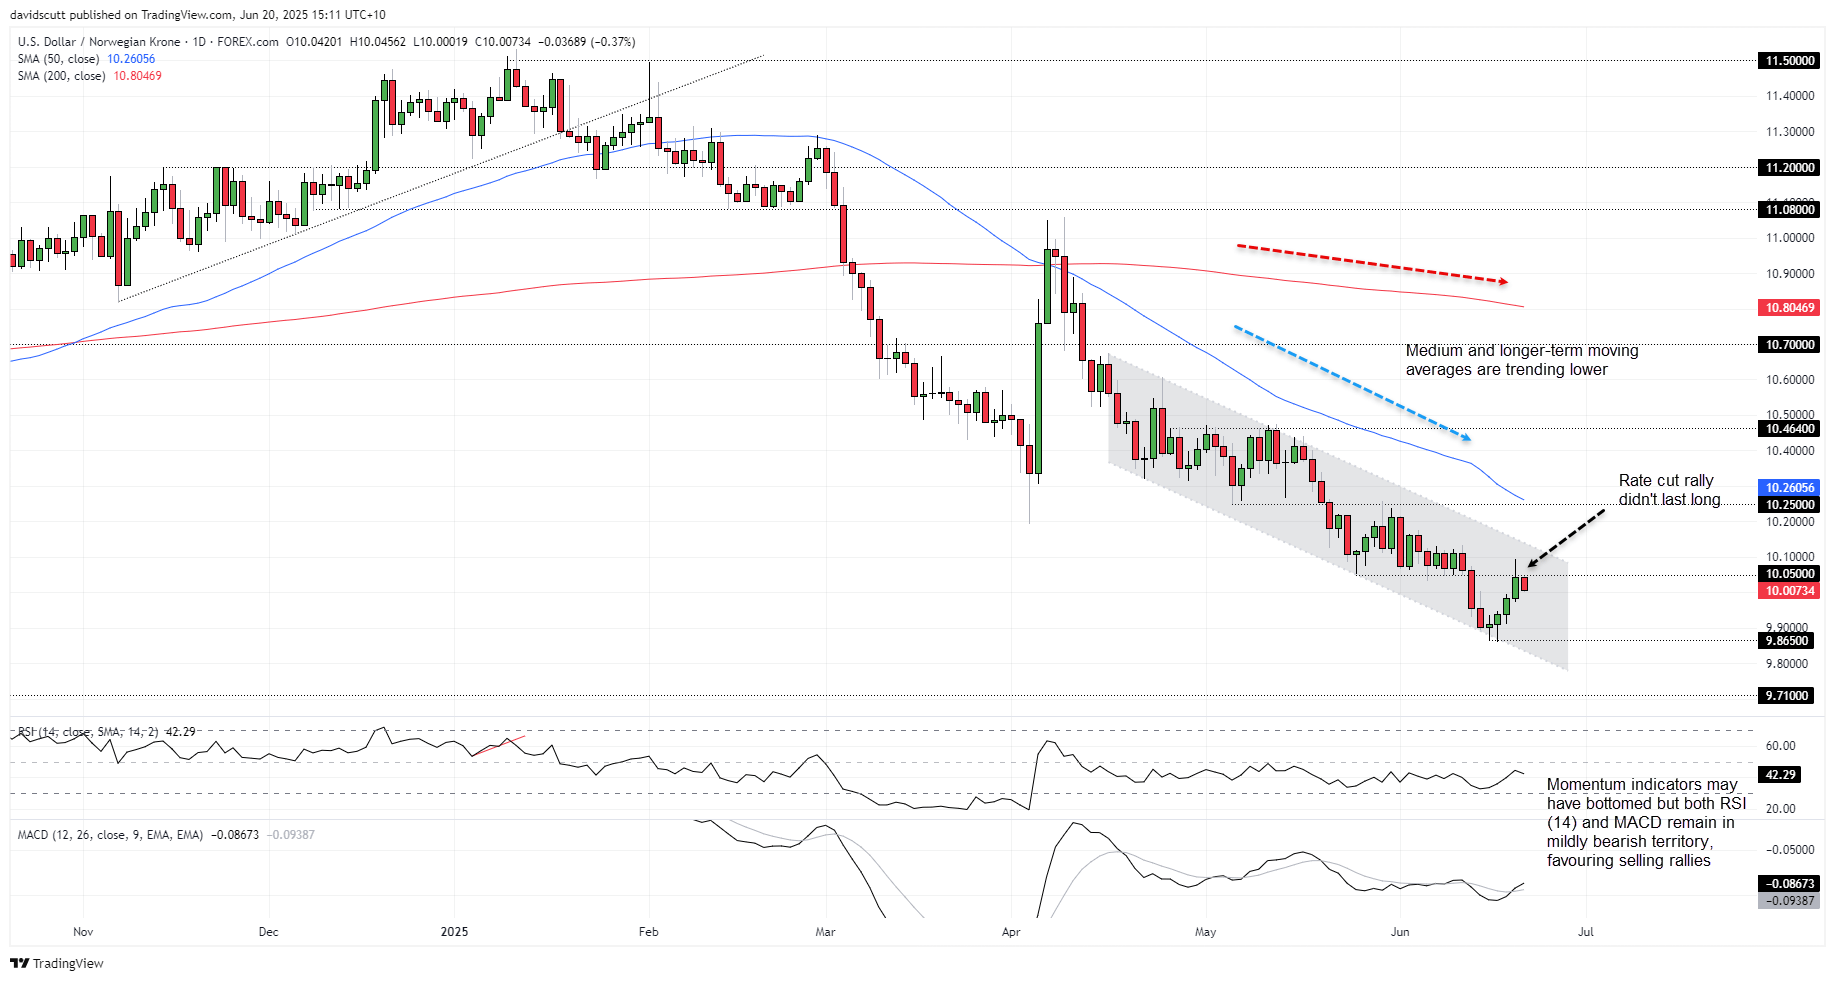
For now, USD/NOK remains in a downtrend established in mid-April. With the 50 and 200-day moving averages trending lower and indicators like RSI (14) and MACD providing mildly bearish signals despite having bottomed near-term, the broader backdrop is one that favours selling rallies over buying dips.
Resistance levels of note include 10.05, 10.25, the 50-day moving average and 10.464. On the downside, bids may emerge at 10.00 and again at 9.865 where the pair bounced earlier this month. A break of the latter would bring a retest of the late 2022 lows of 9.71 into play.
-- Written by David Scutt
Follow David on Twitter @scutty
How to trade with City Index
You can trade with City Index by following these four easy steps:
- Open an account, or log in if you’re already a customer
• Open an account in the UK
• Open an account in Australia
• Open an account in Singapore
- Search for the market you want to trade in our award-winning platform
- Choose your position and size, and your stop and limit levels
- Place the trade
Related tags:


The complete CFD trading experience
Award-winning platforms, competitive spreads, low commissions and dedicated support.
We live and breathe the markets and are dedicated to helping traders realise their ambitions as we continue to set the industry bar.
Economic calendar
Web Trader platform
Our sophisticated web-based platform is packed with features.
Related articles
EUR/USD forecast: Downside risks persist despite recovery
Amid a lack of any major news, the FX markets have been largely in consolidation mode in the first half of Tuesday’s session. The US dollar eased along with bond yields and oil prices, allowing downbeat currencies like the euro to rebound modestly. With US CPI data due for release on Wednesday, don’t expect much in the way of a sharper decline in USD ahead of it. If anything, we could see the dollar buying resume, especially if crude oil prices catch a bid again amid the ongoing situation.

BTC/USD: Dead-cat bounce or the start of another recovery?
Bitcoin has bounced aggressively after another test of its 50-day moving average, but tech futures remain under pressure. With equity correlations strengthening and bearish momentum building, can BTC/USD sustain the recovery?

GBP/AUD falling wedge points to bullish breakout risk ahead of RBA minutes
GBP/AUD is forming a potential bullish continuation pattern, with RBA minutes, Australian unemployment and Bank of England commentary among the catalysts that could spark a breakout.
StoneX Europe Ltd may make third party material available on this website which may contain information included but not limited to the conditions of financial markets. The material is for information purposes only and does not contain, and should not be construed as containing, investment advice and/or investment recommendation and/or an investment research and/or an offer of or solicitation for any transactions in financial instruments; any decision to enter into a specific transaction shall be made by the client following an assessment by him/her of their situation.
StoneX Europe Ltd makes no representation or warranty and assumes no liability as to the accuracy or completeness of the information provided, nor any loss arising from any investment based on a recommendation, forecast or other information supplied. You should always seek independent advice as to your suitability to speculate in any related markets and your ability to assume the associated risks, if you are at all unsure. We are not under any obligation to update any such material. Any opinion made may be personal to the author and may not reflect the opinion of StoneX Europe Ltd.