


USD/CAD Forecast: BoC caution limits Canadian dollar strength
The trading week continues to advance and, for now, the Canadian dollar has started to lose the strength it had shown in previous sessions. USD/CAD movements are barely registering a short-term variation near 0.05%, highlighting a loss of momentum.
Share this:

The trading week continues to advance and, for now, the Canadian dollar has started to lose the strength it had shown in previous sessions. USD/CAD movements are barely registering a short-term variation near 0.05%, highlighting a loss of momentum.
For now, the selling pressure that USD/CAD had been showing has not managed to stabilize significantly after the Bank of Canada decision, which pointed to caution in monetary policy.
If the central bank fails to become a relevant catalyst for Canadian dollar demand, a phase of indecision could start to gain importance in USD/CAD movements over the next few sessions.


BoC day arrives
During the session, the Bank of Canada published its interest rate decision, keeping the rate unchanged at 2.25%, in line with expectations. The institution stated that current levels remain appropriate to support the economic recovery and bring inflation back toward the 2.00% target.
This stance reflects a cautious tone from the central bank. Although annual inflation in Canada has increased toward 3.2%, it is still not far enough from the target to justify a more aggressive stance. In addition, the bank continues to highlight that uncertainty remains elevated and that, with current rates, inflation should gradually ease.
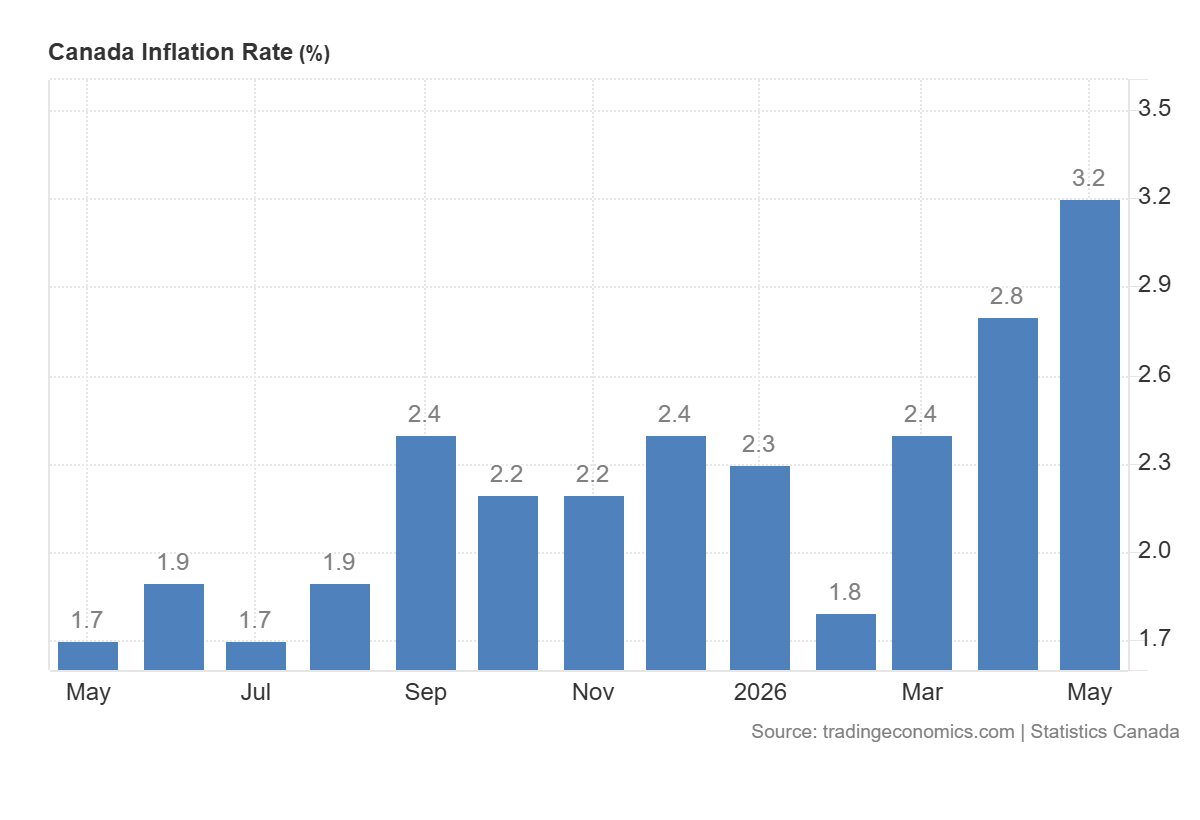
Source: TradingEconomics
For now, this decision has not been enough to strengthen the Canadian dollar. The lack of signals around higher rates limits the appeal of CAD-denominated assets, especially compared to USD alternatives.
This dynamic is also reflected in Canada’s 10-year bonds, whose yield showed a decline close to -1.00% during the session. In addition, the spread against 10-year U.S. bonds remains relevant, as U.S. bonds still maintain a yield almost 1.00% higher.
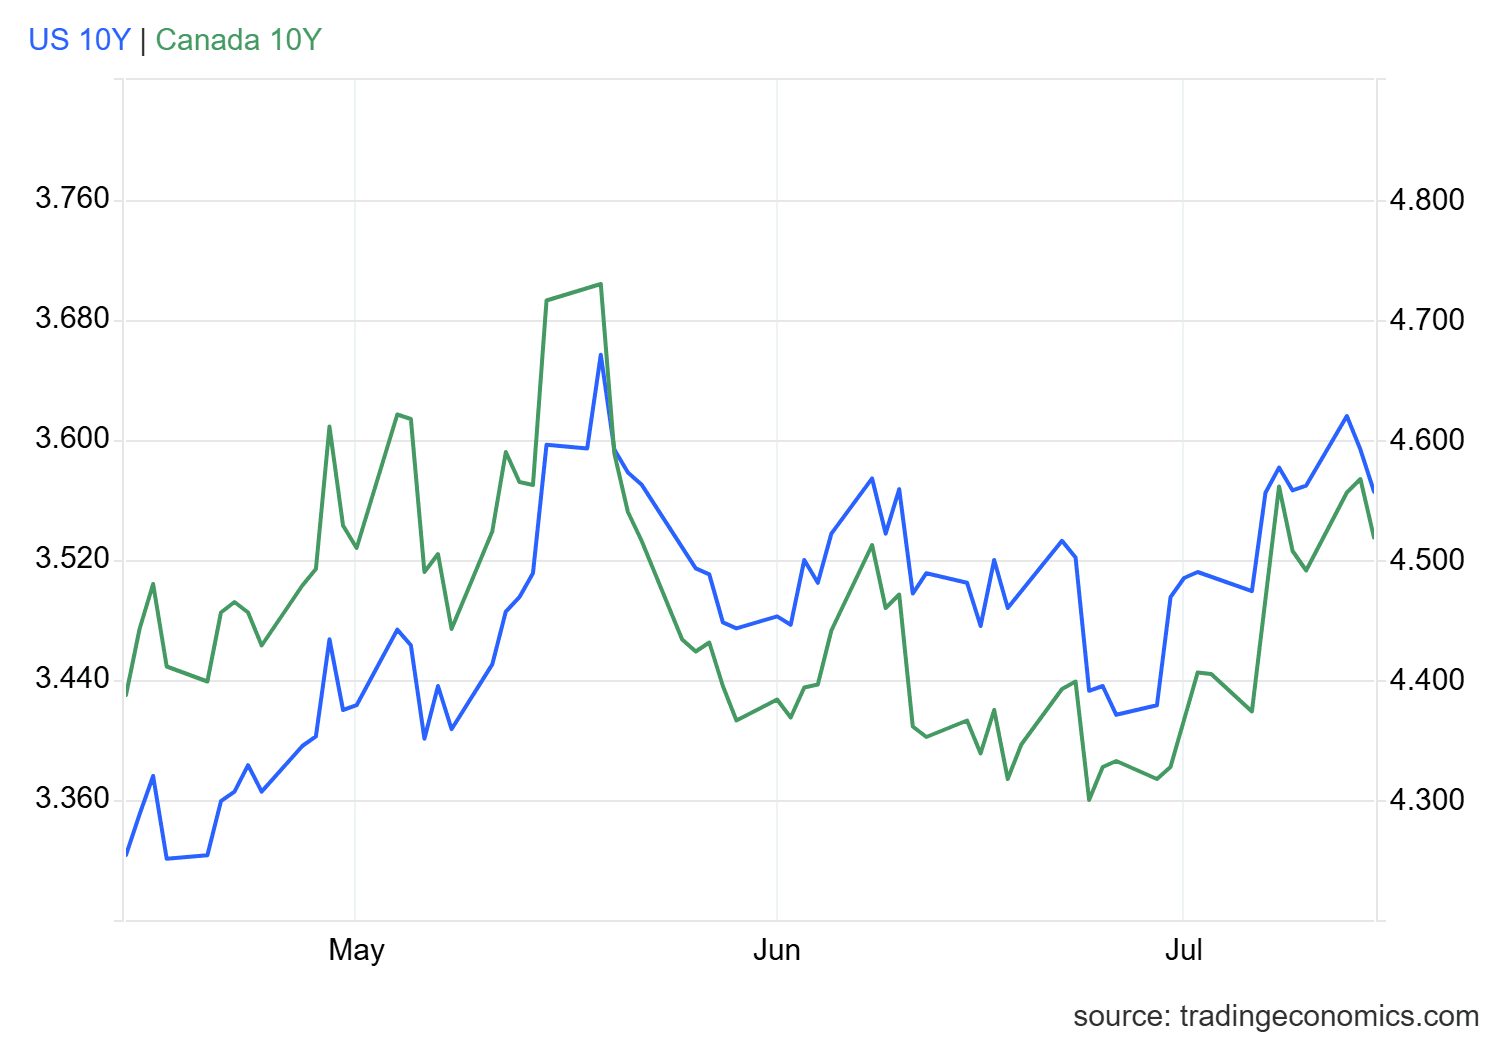
Source: TradingEconomics
In this context, the Bank of Canada decision came without major surprises and failed to clearly improve the appeal of the Canadian market. For this reason, the recent recovery in the Canadian dollar appears to be explained more by U.S. dollar weakness than by the CAD’s own strength.
If new comments or data in the United States provide renewed support for the USD, USD/CAD could enter a phase of greater indecision over the next few trading sessions.
Technical forecast for USD/CAD
Source: StoneX, Tradingview
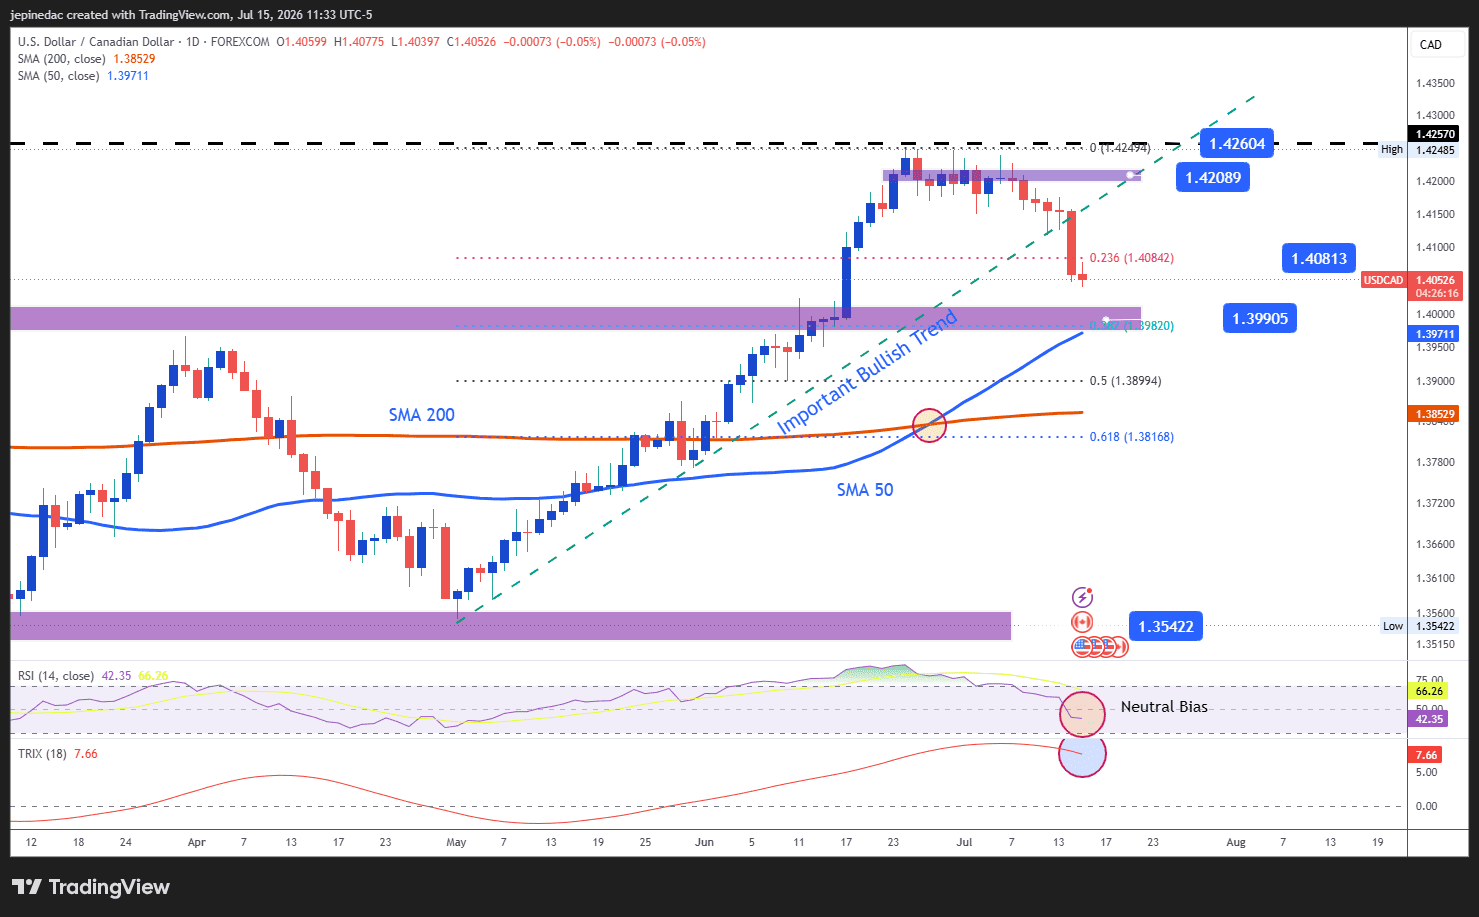
- The uptrend comes to an end: Since the first days of May, USD/CAD had managed to maintain a consistent bullish trend line, which remained the dominant technical structure over recent weeks. However, with the recent price decline and U.S. dollar weakness, this trend line has been crossed in recent sessions. Despite the recent selling pressure, current movements have started to show a new sense of neutrality. If this behavior continues and the selling bias fails to stabilize, room could open for a phase of indecision or even the formation of a sideways range over the next few trading sessions.
- RSI: The RSI line remains close to the 50 level. This indicates that, for now, there is still a balance between bullish and bearish impulses in the market over the last 14 sessions. This reading shows that a phase of indecision has not been fully eliminated from the USD/CAD daily chart.
- TRIX: A similar dynamic can be seen in the TRIX. Although the line remains above the 0 level, indicating that the dominant strength of long-term exponential moving averages remains in bullish territory, a relevant flattening of the curve has started to appear. This suggests that the buying impulse from previous weeks has entered an important stagnation zone and makes a possible phase of neutrality relevant again on the USD/CAD daily chart.
Key levels:
- 1.42089 – Relevant resistance: This 2026 high remains the most important buying barrier on the chart. Price movements toward this area could reactivate a buying bias and restore relevance to the bullish trend line that was important in previous weeks.
- 1.40813 – Near-term barrier: This nearby zone corresponds to the most relevant 23.6% Fibonacci level on the chart. Price movements that fail to move consistently away from this level could continue to highlight an important phase of neutrality and even open room for the formation of a short-term sideways range.
- 1.39905 – Crucial support: This relevant bearish barrier corresponds to the 38.2% Fibonacci retracement area and also aligns with the 50-period simple moving average. Price movements below this level could reaffirm a more consistent selling bias and open room for a possible short-term bearish trend line over the next few sessions.
Written by Julian Pineda, CFA, CMT – Market Analyst
Follow him on: @julianpineda25
Latest market news




The complete CFD trading experience
Award-winning platforms, competitive spreads, low commissions and dedicated support.
We live and breathe the markets and are dedicated to helping traders realise their ambitions as we continue to set the industry bar.
Economic calendar
Web Trader platform
Our sophisticated web-based platform is packed with features.
Related articles
Canadian Dollar Short-term Outlook: USD/CAD Five-Week Rally Hits a Wall at Major Resistance 10 14 2026
USD/CAD is holding near fresh yearly highs, but bearish divergence and a well-defined October range raise the stakes at major resistance.

EUR/USD Analysis: Euro Loses Ground After a Stronger-Than-Expected U.S. CPI Report
The trading week continues to unfold and weakness around the euro has once again become increasingly evident in the short term. This can be seen in the recent performance of EUR/USD, which has declined roughly 0.3% over the last three trading sessions, highlighting renewed strength in the U.S. dollar.

USD/JPY forecast: hot US CPI lifts the pair above its 200-day average
Hotter-than-expected US inflation has pushed USD/JPY above its 200-day moving average, putting 160 and the risk of Bank of Japan intervention back in focus. The breakout still needs to hold, and a failure could send the pair sharply lower.

StoneX Europe Ltd may make third party material available on this website which may contain information included but not limited to the conditions of financial markets. The material is for information purposes only and does not contain, and should not be construed as containing, investment advice and/or investment recommendation and/or an investment research and/or an offer of or solicitation for any transactions in financial instruments; any decision to enter into a specific transaction shall be made by the client following an assessment by him/her of their situation.
StoneX Europe Ltd makes no representation or warranty and assumes no liability as to the accuracy or completeness of the information provided, nor any loss arising from any investment based on a recommendation, forecast or other information supplied. You should always seek independent advice as to your suitability to speculate in any related markets and your ability to assume the associated risks, if you are at all unsure. We are not under any obligation to update any such material. Any opinion made may be personal to the author and may not reflect the opinion of StoneX Europe Ltd.