



USDJPY, USDCAD Outlook: Bullish Rebounds on Hold
Dollar pairs are holding their bullish rebounds below key resistance levels, as U.S. economic data remains absent amid the ongoing government shutdown.
Share this:

Key Events
- USDJPY holds above 150, yet remains capped by 153, limiting bullish continuation.
- USDCAD holds above 1.40, yet is challenged by 1.4080, keeping gains in check.
- DXY holds above 98, but struggles to break the 100 mark.
- The U.S. government shutdown keeps dollar pairs afloat amid missing economic releases.
With CPI and payroll reports still missing this month — and no clear timeline for resolving the government shutdown — the U.S. Dollar Index (DXY) continues to trade above 98, but remains pressured below 100. Meanwhile, USDCAD is testing 1.4080 resistance, and USDJPY faces resistance at 153.30.
This setup reflects a similar rhythm across dollar pairs: a paused bullish rebound held back by key resistance zones and overbought daily momentum. The following scenarios highlight potential confirmations or reversals across both pairs.
The scenarios are technically defined below:
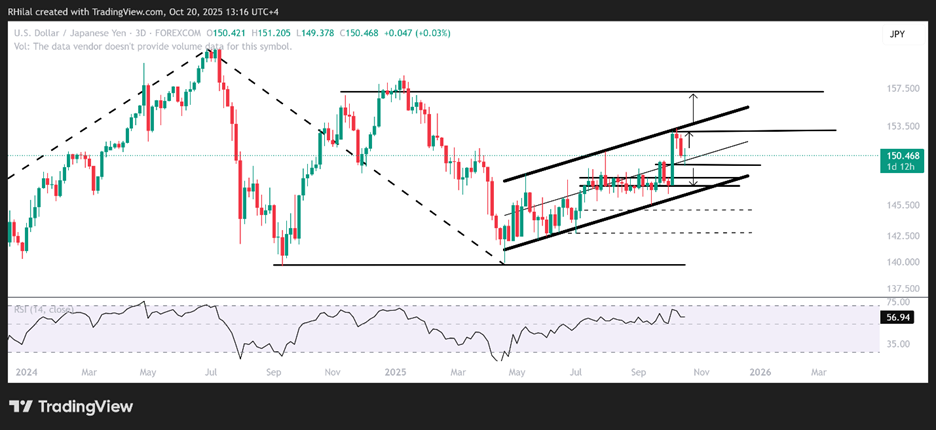
USDJPY Outlook: 3 Day Time Frame – Log Scale
Source: Tradingview
The USDJPY is currently trading above the mid-zone of a well-respected ascending channel that has been in place since the April 2025 lows, and below its upper boundary. Two critical confirmation levels define the near-term projection:
- Bullish Scenario:
- A sustained hold above 150 (the channel’s mid-zone) keeps the price aligned with the upper boundary near 153.30.
- A confirmed breakout above 153.30 would signal a continuation toward the 2025 highs near 157, and potentially higher — supported by a bullish rebound in the weekly RSI from oversold territory (as shown in the upcoming chart).
- Bearish Scenario:
- A close back below 150 would expose the pair to a deeper correction toward the channel’s lower boundary near 147.30, which also aligns with the 0.44 Fibonacci retracement of the rebound between April 2025 (139.88) and October 2025 (151.16).
- Should the lower boundary break, the bullish scenario would fade, with potential downside targets at 145.00 and 142.80.
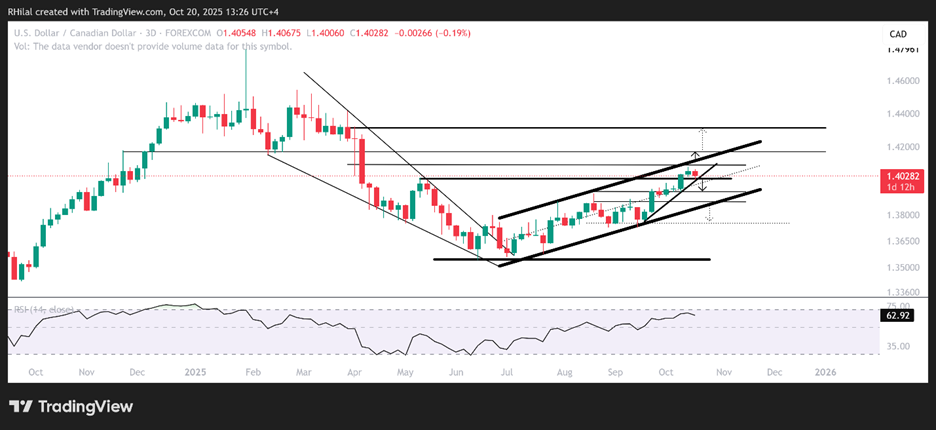
USDCAD Outlook: 3-Day Time Frame – Log Scale
Source: Tradingview
Similar to USDJPY, the USDCAD is holding below the upper boundary of an ascending channel that extends from the June 2025 lows, while maintaining a position above key support at 1.4000 — a previous resistance level turned support.
The 1.4080 mark represents a critical resistance zone, aligning with:
- The upper channel boundary.
- The trendline connecting highs from July to August.
- The 0.44 Fibonacci retracement of the downtrend between January and July 2025.
With the bullish hold persisting amid limited economic data, the scenarios are:
- Bullish Scenario:
- A hold above the upper boundary and 1.41 mark would confirm a bullish continuation toward 1.4180 and 1.4300.
- Bearish Scenario:
- A failure to hold above 1.40 (the channel’s mid-zone) could extend the decline toward the lower boundary at 1.3880, offering potential support.
- A decisive break below that level would open the door to the next support near 1.3750.
Written by Razan Hilal, CMT
Follow on X: @Rh_waves
Related tags:

The complete CFD trading experience
Award-winning platforms, competitive spreads, low commissions and dedicated support.
We live and breathe the markets and are dedicated to helping traders realise their ambitions as we continue to set the industry bar.
Economic calendar
Web Trader platform
Our sophisticated web-based platform is packed with features.
Related articles

Nasdaq 100 Forecast: NDX slips as Treasury yields keep rising
U.S. stocks are falling at the start of Q4, as gains in software stocks offset concerns over soaring Treasury yields. U.S. Treasury yields continue to rise, with the 10-year yield up 2 basis points at 5.31% and the 30-year at 5.66%, multi-decade highs.


US Dollar Technical Outlook: DXY Bulls Meet Resistance at Yearly Highs 10 1 2026
The U.S. Dollar has held firm despite fading Fed hike bets, but Friday’s payrolls could test the rally’s staying power.


EUR/USD, GBP/USD Outlook: RSI Hits 2020 Oversold Levels
EUR/USD, GBP/USD Outlook: The EUR/USD daily RSI has fallen to oversold levels last seen in 2020, raising the risk of a reversal across correlated currency pairs, including the US dollar and GBP/USD.
StoneX Europe Ltd may make third party material available on this website which may contain information included but not limited to the conditions of financial markets. The material is for information purposes only and does not contain, and should not be construed as containing, investment advice and/or investment recommendation and/or an investment research and/or an offer of or solicitation for any transactions in financial instruments; any decision to enter into a specific transaction shall be made by the client following an assessment by him/her of their situation.
StoneX Europe Ltd makes no representation or warranty and assumes no liability as to the accuracy or completeness of the information provided, nor any loss arising from any investment based on a recommendation, forecast or other information supplied. You should always seek independent advice as to your suitability to speculate in any related markets and your ability to assume the associated risks, if you are at all unsure. We are not under any obligation to update any such material. Any opinion made may be personal to the author and may not reflect the opinion of StoneX Europe Ltd.