





What is "wrong" with gold?
Heading into tonight’s crucial CPI data, gold is trading lower for a fourth consecutive week and has lost ~ 8% from its April 18, $1999 high.
Share this:

Heading into tonight’s crucial CPI data, gold is trading lower for a fourth consecutive week and has lost ~ 8% from its April 18, $1999 high.
After topping in early March at $2070 after the Russian invasion of Ukraine, the decline in gold accelerated in mid-April after a stream of hawkish Fed Speakers raised expectations of a more aggressive hiking cycle.
While there was initial relief after the May FOMC that Fed Chair Powell downplayed the possibility of a 75bp rate hike, he did pre-signal two inflation-busting 50bp rate hikes at the upcoming FOMC meetings in June and July.
The Fed’s more aggressive super tightening cycle, which is expected to take the Feds Fund target back above 3% by early year, has undermined the value of gold for two key reasons outlined below.
Peak inflation
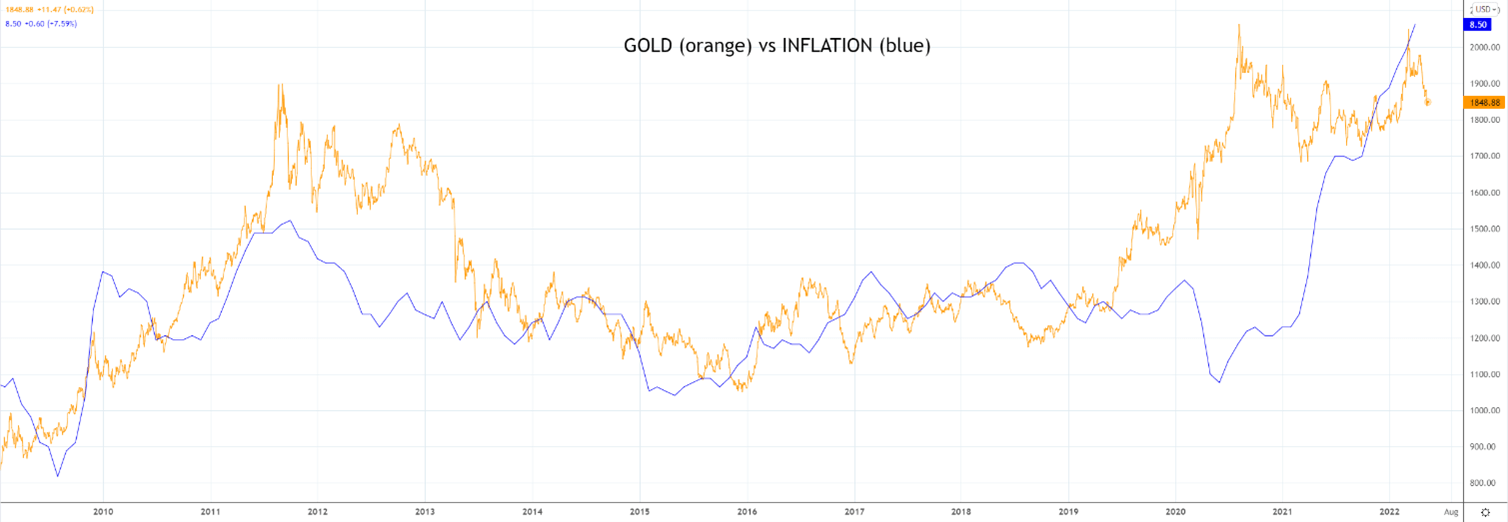
Gold is viewed as an inflation hedge to protect against the debasement of fiat currencies. As can be viewed on the chart below, both inflation and gold have rallied in tandem until recently.
Gold has turned lower, likely pre-empting a slowdown in inflation as early as this evening’s U.S CPI print. Headline inflation for April is expected to slow to an annual rate of 8.1%, down from a 40 year high of 8.5% in March. The core inflation rate is expected to fall from 6.5% to 6%.
Positive U.S real yields
In late November, the renomination of Fed Chair Powell over Fed Governor Lael Brainard was considered a hawkish development and the catalyst for real yields to move away from the deeply negative levels of early November (-117bp).
Overnight, U.S. 10-year real yields (the interest rate adjusted for inflation) closed at +30 points. It is noticeable that the downside move in gold accelerated in mid-April as real yields moved from negative into positive territory.
Positive real yield undermines demand for gold because gold yields nothing. Real yields are expected to continue to move higher while the Fed maintains its hawkish stance.
What do the charts say?
In an article on March 18 here we described the reversal pattern from the $2070 high as “tweezer/double top that could turn out to be one for the ages.” It is also noticeable gold completed an Elliott Wave five wave advance from the $1046, 2015 low.
The ensuing pullback has seen gold slip towards weekly uptrend support near $1830/20. This level is likely to provide initial support. However, if gold does see a sustained break below $1820ish the risks are for a deeper pullback towards range lows $1700/$1670 into year-end.
Source Tradingview. The figures stated are as of May 11, 2022. Past performance is not a reliable indicator of future performance. This report does not contain and is not to be taken as containing any financial product advice or financial product recommendation
How to trade with City Index
You can trade with City Index by following these four easy steps:
- Open an account, or log in if you’re already a customer
• Open an account in the UK
• Open an account in Australia
• Open an account in Singapore
- Search for the company you want to trade in our award-winning platform
- Choose your position and size, and your stop and limit levels
- Place the trade
Heading into tonight’s crucial CPI data, gold is trading lower for a fourth consecutive week and has lost ~ 8% from its April 18, $1999 high.
After topping in early March at $2070 after the Russian invasion of Ukraine, the decline in gold accelerated in mid-April after a stream of hawkish Fed Speakers raised expectations of a more aggressive hiking cycle.
While there was initial relief after the May FOMC that Fed Chair Powell downplayed the possibility of a 75bp rate hike, he did pre-signal two inflation-busting 50bp rate hikes at the upcoming FOMC meetings in June and July.
The Fed’s more aggressive super tightening cycle, which is expected to take the Feds Fund target back above 3% by early year, has undermined the value of gold for two key reasons outlined below.
Peak inflation
Gold is viewed as an inflation hedge to protect against the debasement of fiat currencies. As can be viewed on the chart below, both inflation and gold have rallied in tandem until recently.
Gold has turned lower, likely pre-empting a slowdown in inflation as early as this evening’s U.S CPI print. Headline inflation for April is expected to slow to an annual rate of 8.1%, down from a 40 year high of 8.5% in March. The core inflation rate is expected to fall from 6.5% to 6%.
Positive U.S real yields
In late November, the renomination of Fed Chair Powell over Fed Governor Lael Brainard was considered a hawkish development and the catalyst for real yields to move away from the deeply negative levels of early November (-117bp).
Overnight, U.S. 10-year real yields (the interest rate adjusted for inflation) closed at +30 points. It is noticeable that the downside move in gold accelerated in mid-April as real yields moved from negative into positive territory.
Positive real yield undermines demand for gold because gold yields nothing. Real yields are expected to continue to move higher while the Fed maintains its hawkish stance.
What do the charts say?
In an article on March 18 here we described the reversal pattern from the $2070 high as “tweezer/double top that could turn out to be one for the ages.” It is also noticeable gold completed an Elliott Wave five wave advance from the $1046, 2015 low.
The ensuing pullback has seen gold slip towards weekly uptrend support near $1830/20. This level is likely to provide initial support. However, if gold does see a sustained break below $1820ish the risks are for a deeper pullback towards range lows $1700/$1670 into year-end.
Source Tradingview. The figures stated are as of May 11, 2022. Past performance is not a reliable indicator of future performance. This report does not contain and is not to be taken as containing any financial product advice or financial product recommendation
Related tags:




The complete CFD trading experience
Award-winning platforms, competitive spreads, low commissions and dedicated support.
We live and breathe the markets and are dedicated to helping traders realise their ambitions as we continue to set the industry bar.
Economic calendar
Web Trader platform
Our sophisticated web-based platform is packed with features.
Related articles

FOMC Meeting Preview: Three Questions for Chairman Warsh
Assuming the Fed delivers the expected hike, traders will want to know WHAT could prompt another hike, WHY they hiked this time, and HOW to interpret the dot plot.

USD/JPY Outlook: Bulls get a lifeline from the bond bloodbath
A rare surge in US-Japan yield spreads has failed to lift USD/JPY, but with bond yields still rising and the pair printing a bullish engulfing candle, reversal risk is rising.

USDJPY Forecast Will Inflation Data Be Enough to Move the Yen?
It has not been an easy week for the Japanese yen. Over the last four trading sessions, USD/JPY has posted a move of only around 0.3%, reflecting a market that continues to lack clear direction and remains trapped in a phase of neutrality.

StoneX Europe Ltd may make third party material available on this website which may contain information included but not limited to the conditions of financial markets. The material is for information purposes only and does not contain, and should not be construed as containing, investment advice and/or investment recommendation and/or an investment research and/or an offer of or solicitation for any transactions in financial instruments; any decision to enter into a specific transaction shall be made by the client following an assessment by him/her of their situation.
StoneX Europe Ltd makes no representation or warranty and assumes no liability as to the accuracy or completeness of the information provided, nor any loss arising from any investment based on a recommendation, forecast or other information supplied. You should always seek independent advice as to your suitability to speculate in any related markets and your ability to assume the associated risks, if you are at all unsure. We are not under any obligation to update any such material. Any opinion made may be personal to the author and may not reflect the opinion of StoneX Europe Ltd.