






WTI Gaps Higher after Supply Disruptions
Supply disruptions in Libya and Iraq over the weekend were the culprits for the price jump.
Share this:

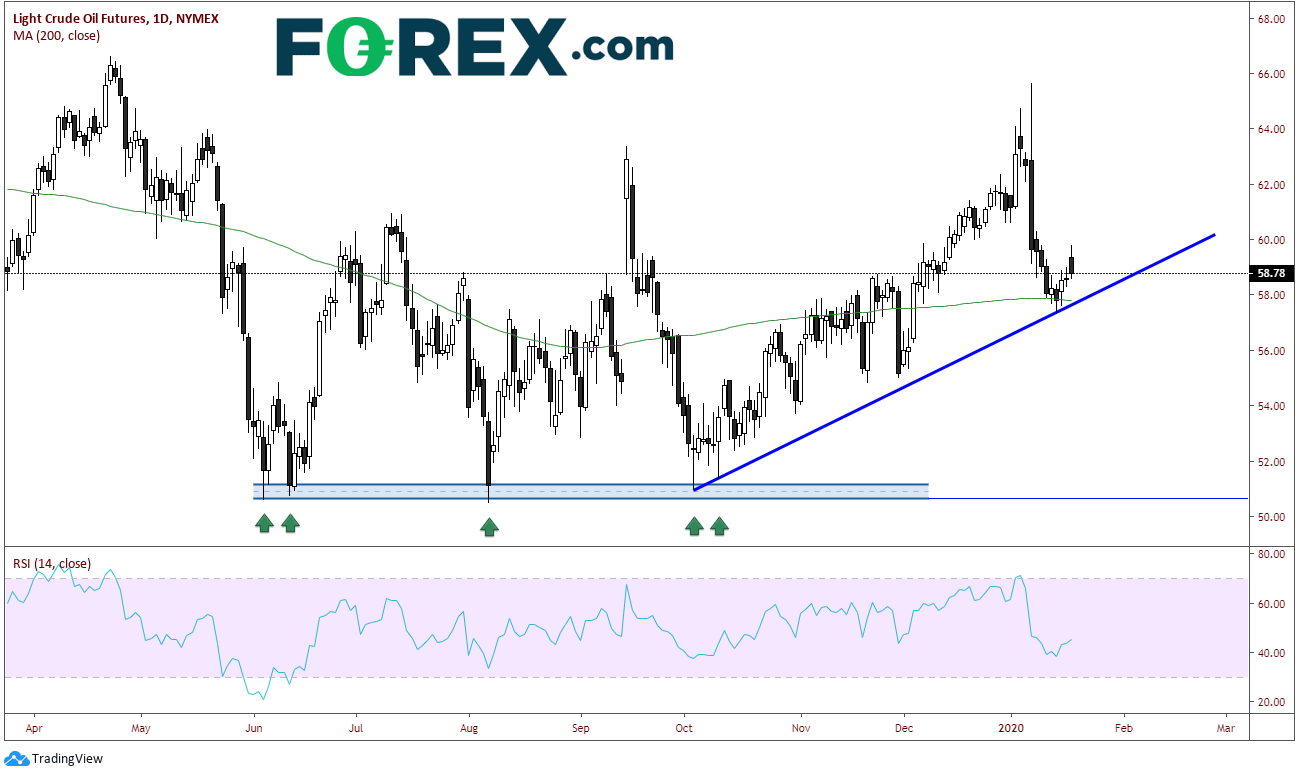
The US equity and bond markets are closed today in observance of Martin Luther King Jr. Day, however the fx markets are open, as well as the overnight session (which is abbreviated) for many futures products. When the crude futures markets opened last night in the US, they gapped higher from a Friday close of 58.58 per barrel to 59.77 per barrel. Supply disruptions in Libya and Iraq over the weekend were the culprits for the price jump. In Libya, military forces shut down a key pipeline. In Iraq, workers protested over working conditions shut down an oil production facility halting oil supply. Price has since pulled back and filled the gap, however WTI is still up 0.4% on the day near 58.75 per barrel.
Source: Tradingview, NYMEX, City Index
Geo-political events have been the focus since the beginning of 2020 for the oil markets, in particular, between the US and Iran. On January 8th, WTI traded as high as 65.65 as Iran attacked US military bases in in Iraq. However, markets faded the move higher and closed at 59.61, down 5% on the day! Over the course of the next few days, price continued to trade lower, however support at the 200-day moving average near 58.00 held. In addition, there is an upward sloping trendline from the October 1st lows which also held near 58.00. On a daily timeframe, today the price action in crude formed a black bearish candle after the gap higher.
Source: Tradingview, NYMEX, City Index
On a 240-minute time-frame, WTI not only support from the daily timeframe, but also the 50% retracement level from the lows on October 3rd to the spike high on January 8th, again near 58.00. If price can continue to hold this level, horizontal resistance above comes across near 60.65 and 62.50. Above that, resistance comes across that the previously mentioned spike highs near 65.65. First support is confluence of indicators mentioned near 58.00. Below that is the 61.8% Fibonacci retracement level of the previously mentioned timeframe near 56.65 and horizonal support near 55.00. Further support is the October 3rd lows near 51.00.
Source: Tradingview, NYMEX, City Index
Continue to watch the 58.00 level for WTI. It has proved to be good support in the near term. In addition, notice that moves higher since the beginning of the year due to geo-political events have tended to be faded. Is this a trend? Also, as mentioned in our Oil week ahead write up, Davos begins this week on Wednesday. Watch for comments which may be market moving. We also have the usually weekly API and DOE data due out Wednesday and Thursday, respectively (delayed 1 day due to the US holiday).
The US equity and bond markets are closed today in observance of Martin Luther King Jr. Day, however the fx markets are open, as well as the overnight session (which is abbreviated) for many futures products. When the crude futures markets opened last night in the US, they gapped higher from a Friday close of 58.58 per barrel to 59.77 per barrel. Supply disruptions in Libya and Iraq over the weekend were the culprits for the price jump. In Libya, military forces shut down a key pipeline. In Iraq, workers protested over working conditions shut down an oil production facility halting oil supply. Price has since pulled back and filled the gap, however WTI is still up 0.4% on the day near 58.75 per barrel.
Source: Tradingview, NYMEX, FOREX.com
Geo-political events have been the focus since the beginning of 2020 for the oil markets, in particular, between the US and Iran. On January 8th, WTI traded as high as 65.65 as Iran attacked US military bases in in Iraq. However, markets faded the move higher and closed at 59.61, down 5% on the day! Over the course of the next few days, price continued to trade lower, however support at the 200-day moving average near 58.00 held. In addition, there is an upward sloping trendline from the October 1st lows which also held near 58.00. On a daily timeframe, today the price action in crude formed a black bearish candle after the gap higher.
Source: Tradingview, NYMEX, FOREX.com
On a 240-minute time-frame, WTI not only support from the daily timeframe, but also the 50% retracement level from the lows on October 3rd to the spike high on January 8th, again near 58.00. If price can continue to hold this level, horizontal resistance above comes across near 60.65 and 62.50. Above that, resistance comes across that the previously mentioned spike highs near 65.65. First support is confluence of indicators mentioned near 58.00. Below that is the 61.8% Fibonacci retracement level of the previously mentioned timeframe near 56.65 and horizonal support near 55.00. Further support is the October 3rd lows near 51.00.
Source: Tradingview, NYMEX, FOREX.com
Continue to watch the 58.00 level for WTI. It has proved to be good support in the near term. In addition, notice that moves higher since the beginning of the year due to geo-political events have tended to be faded. Is this a trend? Also, as mentioned in our Oil week ahead write up, Davos begins this week on Wednesday. Watch for comments which may be market moving. We also have the usually weekly API and DOE data due out Wednesday and Thursday, respectively (delayed 1 day due to the US holiday).
Related tags:
Latest market news




The complete CFD trading experience
Award-winning platforms, competitive spreads, low commissions and dedicated support.
We live and breathe the markets and are dedicated to helping traders realise their ambitions as we continue to set the industry bar.
Economic calendar
Web Trader platform
Our sophisticated web-based platform is packed with features.
Related articles
RBA delivers 25bp hike, Bullock now the main event
The RBA delivered the expected 25bp hike, but Bullock’s press conference now looms as the bigger volatility risk for AUD/USD and the ASX 200.
EUR/USD, USD/JPY Outlook: Oil, yields and an FX identity crisis
Crude oil is setting the tone across rates and FX, leaving EUR/USD vulnerable and USD/JPY caught between higher Treasury yields and the growing threat of intervention
AUD/USD Analysis: What's Next for the Australian Dollar After the RBA Decision?
Recent trading sessions have reflected a more neutral tone around the Australian dollar. This can be seen in AUD/USD price action, which has posted moves of roughly 0.2% over the last two sessions without establishing a clear direction. Much of this lack of momentum is linked to expectations surrounding the next policy moves from both the Reserve Bank of Australia (RBA) and the Federal Reserve.

StoneX Europe Ltd may make third party material available on this website which may contain information included but not limited to the conditions of financial markets. The material is for information purposes only and does not contain, and should not be construed as containing, investment advice and/or investment recommendation and/or an investment research and/or an offer of or solicitation for any transactions in financial instruments; any decision to enter into a specific transaction shall be made by the client following an assessment by him/her of their situation.
StoneX Europe Ltd makes no representation or warranty and assumes no liability as to the accuracy or completeness of the information provided, nor any loss arising from any investment based on a recommendation, forecast or other information supplied. You should always seek independent advice as to your suitability to speculate in any related markets and your ability to assume the associated risks, if you are at all unsure. We are not under any obligation to update any such material. Any opinion made may be personal to the author and may not reflect the opinion of StoneX Europe Ltd.