




Asian Open: Equities lose steam, gold edges lower ahead of US CPI
A little mean reversion could be expected after Wall Street posted three solid days of gains this week, and gold looks a little nervous ahead of US inflation.
Share this:

Asian Futures:
- Australia's ASX 200 futures are up 22 points (0.3%), the cash market is currently estimated to open at 7,451.30
- Japan's Nikkei 225 futures are up 360 points (1.26%), the cash market is currently estimated to open at 28,815.60
- Hong Kong's Hang Seng futures are down -62 points (-0.26%), the cash market is currently estimated to open at 23,892.91
- China's A50 Index futures are up 184 points (1.16%), the cash market is currently estimated to open at 16,153.88
Thursday US Close:
- The Dow Jones Industrial fell -0.06 points (0%) to close at 35,754.69
- The S&P 500 index rose 95.08 points (2.08%) to close at 4,686.75
- The Nasdaq 100 index rose 479.503 points (3.03%) to close at 16,325.66


US jobless claims fell to a 52-year low and the US Senate cleared another hurdle towards lifting the debt ceiling (which currently sits at $28.9 trillion) by passing one of the two required bills. Former Fed Chair turned Treasury Secretary Janet Yellen wants the second bills passed by 15th December to get it over the line. Yet equity markets closed mostly lower as these are not new themes, and traders likely booked some profits following strong rebounds over the prior three days, ahead of today’s all-important inflation data from the US. Sentiment was also dented as governments reintroduced restrictions to slow the spread of the Omicron variant.
BOC to conduct review of inflationary forces in January
The Bank of Canada warned that inflation could remain above target longer than originally thought, with Assistant Governor Toni Gravelle saying the central bank will conduct a thorough review of inflationary forces in January. Dare we say this could prompt them to raise rates in Q1 if they don’t like what they find?
The Japanese yen, US dollar and British pound were the strongest majors. GBP pairs recouped some of their ‘plan B’ losses after 3-days of heavy selling. EUR/USD is back below 1.13 yet holding above Wednesday’s low, and we expect a tight trading range ahead of US inflation.
AUD/JPY’s risk-on rally has stalled at trend resistance. But we likely need to see a break above 82 or below 80.67 before becoming too excited about any break of that trendline. Still, the bearish inside day shows it is hesitant to break above it immediately.
Government restrictions weights on oil demand expectations
Oil was also lower as covid restrictions weighed on the outlook for demand. WTI topped out just above $73 and at its 20-day eMA before falling around -2.6% to form a bearish outside day, which itself is part of a 3-bar reversal called an evening star formation. As RSI (2) was also overbought the odds favour a retracement in line with yesterday’s trade.
Gold teases bears with a bearish wedge ahead of US inflation
Gold has been trading in a tight range ahead key inflation data from the US. A hot-print is essentially a proxy for Fed tightening, via a faster pace of tapering which could bring forward the potential for a rate hike. The best bet for gold bugs is a soft inflation print today. This scenario is not being widely discussed, therefore it should be considered as the anti-consensus moves can spark the more volatile reaction. However, if it does come in nice and strong to pave the way for earlier Fed action, we’d expect gold prices to head for the November low at 1758, which itself is a key level which could trigger large stops (and more selling) if broken.
Learn about gold trading: How do you trade gold on forex markets?
Learn about gold trading: How do you trade gold on forex markets?
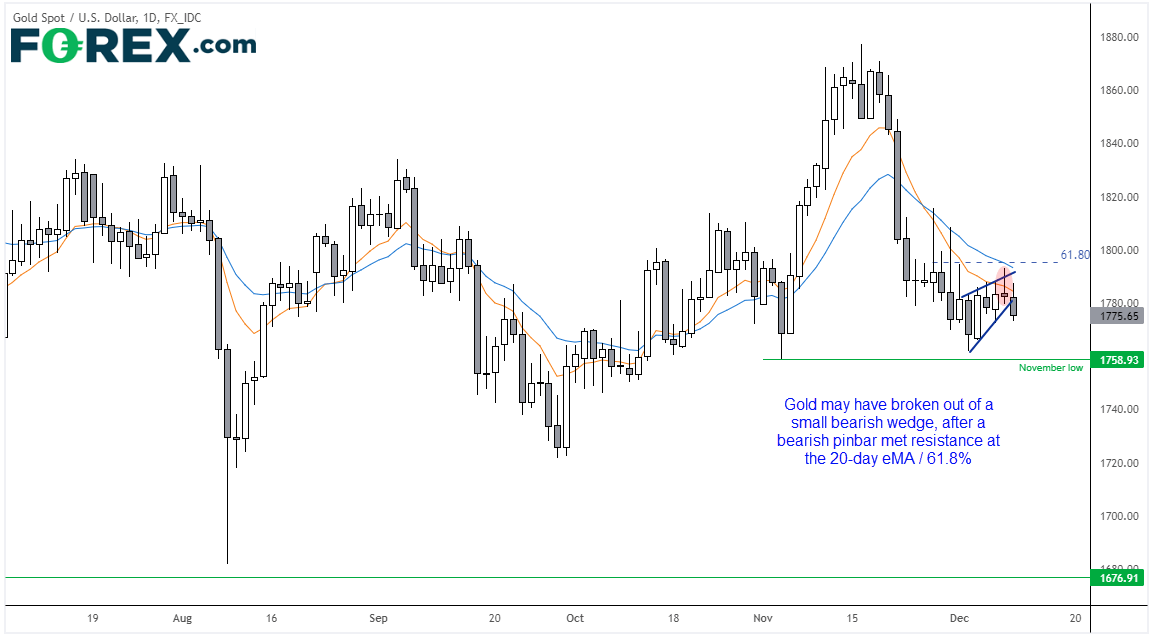
Gold may have broken out of a small wedge formation overnight, after a bearish pinbar met resistance just below the 20-day eMA and 61.8% Fibonacci ration on Wednesday. The target projects a profit objects at the base of the pattern around 1762, and the likely success of the pattern likely depends on today’s inflation report.
ASX 200 Market Internals:

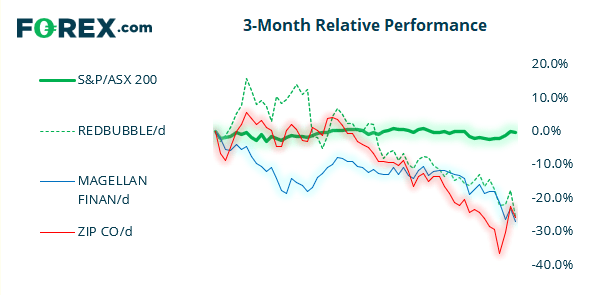
ASX 200: 738435 (-0.28%), 09 December 2021
- Materials (-0.51%) was the strongest sector and Utilities (0.4%) was the weakest
- 8 out of the 11 sectors closed lower
- 5 out of the 11 sectors outperformed the index
- 76 (38.00%) stocks advanced, 108 (54.00%) stocks declined
- 60% of stocks closed above their 200-day average
- 56% of stocks closed above their 50-day average
- 49.5% of stocks closed above their 20-day average
Outperformers:
- + 4.66% - AGL Energy Ltd (AGL.AX)
- + 3.18% - Appen Ltd (APX.AX)
- + 2.87% - Sydney Airport (SYD.AX)
Underperformers:
- -9.31% - Redbubble Ltd (RBL.AX)
- -4.88% - Magellan Financial Group Ltd (MFG.AX)
- -4.16% - Zip Co Ltd (Z1P.AX)
Up Next (Times in AEDT)
How to trade with City Index
You can easily trade with City Index by using these four easy steps:
- Open an account, or log in if you’re already a customer
• Open an account in the UK
• Open an account in Australia
• Open an account in Singapore
- Search for the company you want to trade in our award-winning platform
- Choose your position and size, and your stop and limit levels
- Place the trade
How to trade with FOREX.com
Follow these easy steps to start trading with FOREX.com today:
- Open a Forex.com account, or log in if you’re already a customer.
- Search for the pair you want to trade in our award-winning platform.
- Choose your position and size, and your stop and limit levels.
- Place the trade.


Open an account in minutes
Experience award-winning platforms with fast and secure execution, and enjoy tight spreads from 0.5 pts on FX and 0.3 pts on indices.
Economic calendar
Web Trader platform
Our sophisticated web-based platform is packed with features.
Related articles
Gold Breaks Down on Descending Triangle, Sets Up $4k Test
Gold started last week with a strong sell-off but from that move a bounce developed. Bulls could not hold on through the weekly close, however, and the bearish structure remains in-place for XAU/USD.

USD/JPY weekly outlook: Quarter turn scrambles rates regime
USD/JPY’s tight relationship with front-end US rates broke down sharply last week, but quarter-turn flows and positioning suggest the disconnect may prove temporary.


Gold Update: XAU/USD Remains Under Pressure Even After the NFP Report
As the trading week comes to an end, weakness around gold price action remains evident in the short term. This can be seen in the performance of the past two sessions, where the metal has declined by approximately 0.3%. Although the move has not been particularly aggressive, it highlights that buying pressure continues to struggle to regain control of the market.

This report is intended for general circulation only. It should not be construed as a recommendation, or an offer (or solicitation of an offer) to buy or sell any financial products. The information provided does not take into account your specific investment objectives, financial situation or particular needs. Before you act on any recommendation that may be contained in this report, independent advice ought to be sought from a financial adviser regarding the suitability of the investment product, taking into account your specific investment objectives, financial situation or particular needs.
StoneX Financial Pte. Ltd., may distribute reports produced by its respective foreign entities or affiliates within the StoneX group of companies or third parties pursuant to an arrangement under Regulation 32C of the Financial Advisers Regulations. Where the report is distributed to a person in Singapore who is not an accredited investor, expert investor or an institutional investor (as defined in the Securities Futures Act), StoneX Financial Pte. Ltd. accepts legal responsibility to such persons for the contents of the report only to the extent required by law. Singapore recipients should contact StoneX Financial Pte. Ltd. at 6826 9988 for matters arising from, or in connection with the report.
In the case of all other recipients of this report, to the extent permitted by applicable laws and regulations neither StoneX Financial Pte. Ltd. nor its associated companies will be responsible or liable for any loss or damage incurred arising out of, or in connection with, any use of the information contained in this report and all such liability is hereby expressly disclaimed. No representation or warranty is made, express or implied, that the content of this report is complete or accurate.
StoneX Financial Pte. Ltd. is not under any obligation to update this report.
Trading CFDs carries a high level of risk that may not be suitable for some investors. Consider your investment objectives, level of experience, financial resources, risk appetite and other relevant circumstances carefully. The possibility exists that you could lose some or all of your investments, including your initial deposits. If in doubt, please seek independent expert advice. Visit www.forex.com/en-sg/terms-and-policies for the complete Risk Disclosure Statement.