



ASX 200 Morning Market Outlook: Sectors Support Fresh Breakout
ASX 200 breaks above 9,000 with sector momentum pointing to further gains as materials, industrials, and financials lead the rally.
Share this:

The ASX 200 surged through the 9,000 level on Wednesday, its best performance in over eight weeks. Price action across major sectors suggests the breakout could have more room to run, with materials, industrials, and financials leading momentum while energy and real estate show signs of recovery.
View related analysis:
View related analysis:
ASX 200 Outlook: Sector Strength Reinforces Breakout
ASX 200 Market Snapshot
- Wednesday’s bullish breakout and 1.1% gain was the best performance for the ASX 200 in over eight weeks
- Up 2.3% from Friday’s close, the ASX 200 is on track for its best week in eight or its most volatile week in four
- 146 (76%) stocks advanced to show breadth behind the rally, 42 (21%) declined, 12 (6%) were unchanged
- Healthcare, materials and financials led the 8 sectors higher, while the 3 sectors that declined only saw marginal losses
- Despite the strong breakout, the ASX has clearly lagged behind the DAX and Nikkei over the past 60 days

Chart analysis by Matt Simpson - data source: ASX, LSEG


ASX 200 Sector Analysis
The ASX 200 materials sector leads the index higher with an 18% rally year-to-date, now back above 19,000 and trending towards record highs.
The industrials sector has rebounded from last week’s low, suggesting its correction from the August peak may be complete, with potential for a move above 8,800.
The ASX 200 financials sector remains closely correlated with the broader index. Its latest rebound signals a cycle low could be in place, with momentum building towards a new high.
The real estate sector has formed a higher low above 4,000, with momentum shifting higher alongside the broader market, hinting that its corrective phase has ended.
The energy sector is showing signs of a potential double bottom, pointing to at least a short-term bounce if not a broader recovery in line with the ASX 200.
Meanwhile, the consumer discretionary sector has seen only a shallow retracement, which suggests the uptrend may soon resume.
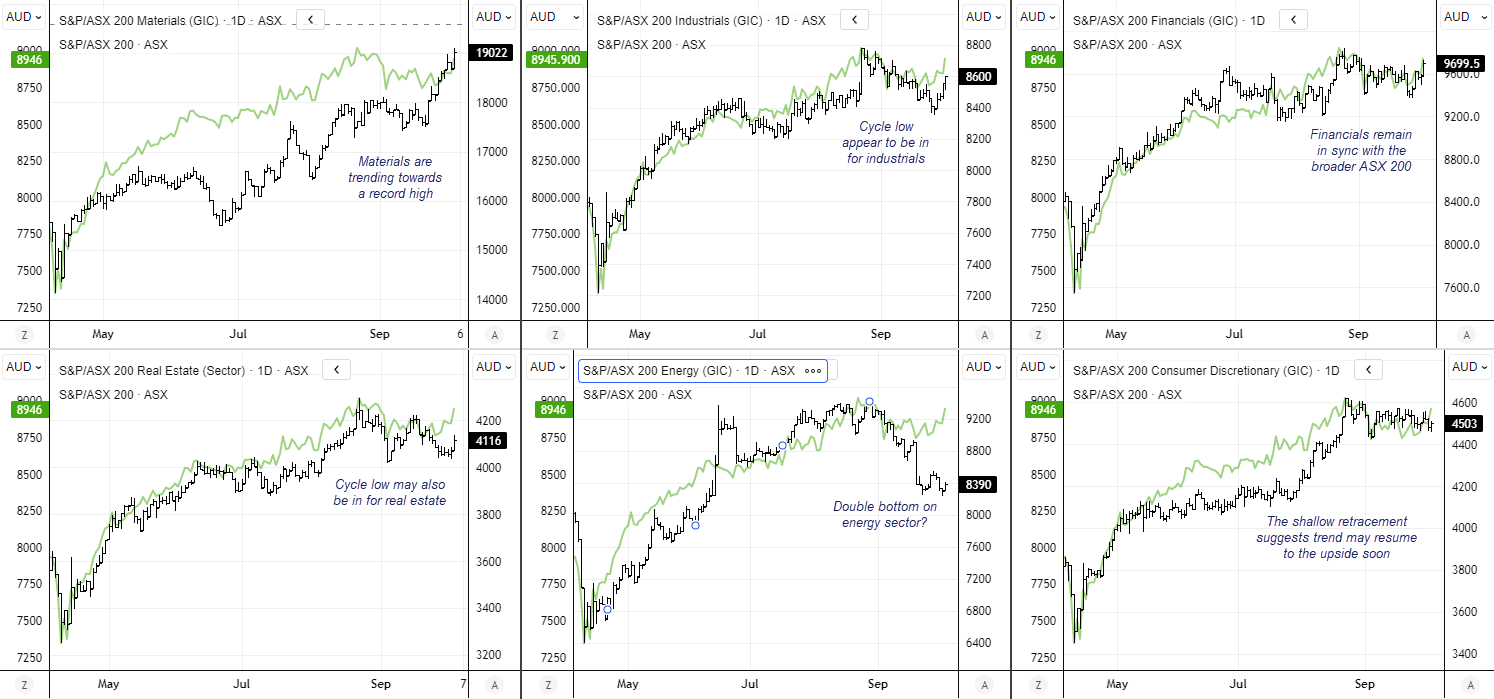
Chart analysis by Matt Simpson - data source: ASX, LSEG
ASX 200 Technical Analysis
Thursday’s bullish breakout was constructive, though it is less than ideal that it occurred on below-average volume. And while the ASX 200 tagged the 9,000 target, prices appear hesitant to push higher for now. Also note that the daily RSI (2) reached heavily overbought territory on the breakout day, warning of a possible near-term pause. That said, the RSI (14) is not overbought and is confirming the rally, so my bias remains for an eventual retest and break to new highs.
Bulls could seek dips towards the 8,900 area in anticipation of a move back to the all-time high (ATH). Note the 8,793–8,979 resistance zone nearby, which is comprised of the cash market and overnight VPOCs (volume point of controls). The upper 1-standard deviation band for the 1-week VWAP is also near the September high (8,939) for potential support, while Wednesday’s overnight VPOC and weekly VWAP sit around 8,899–8,909.
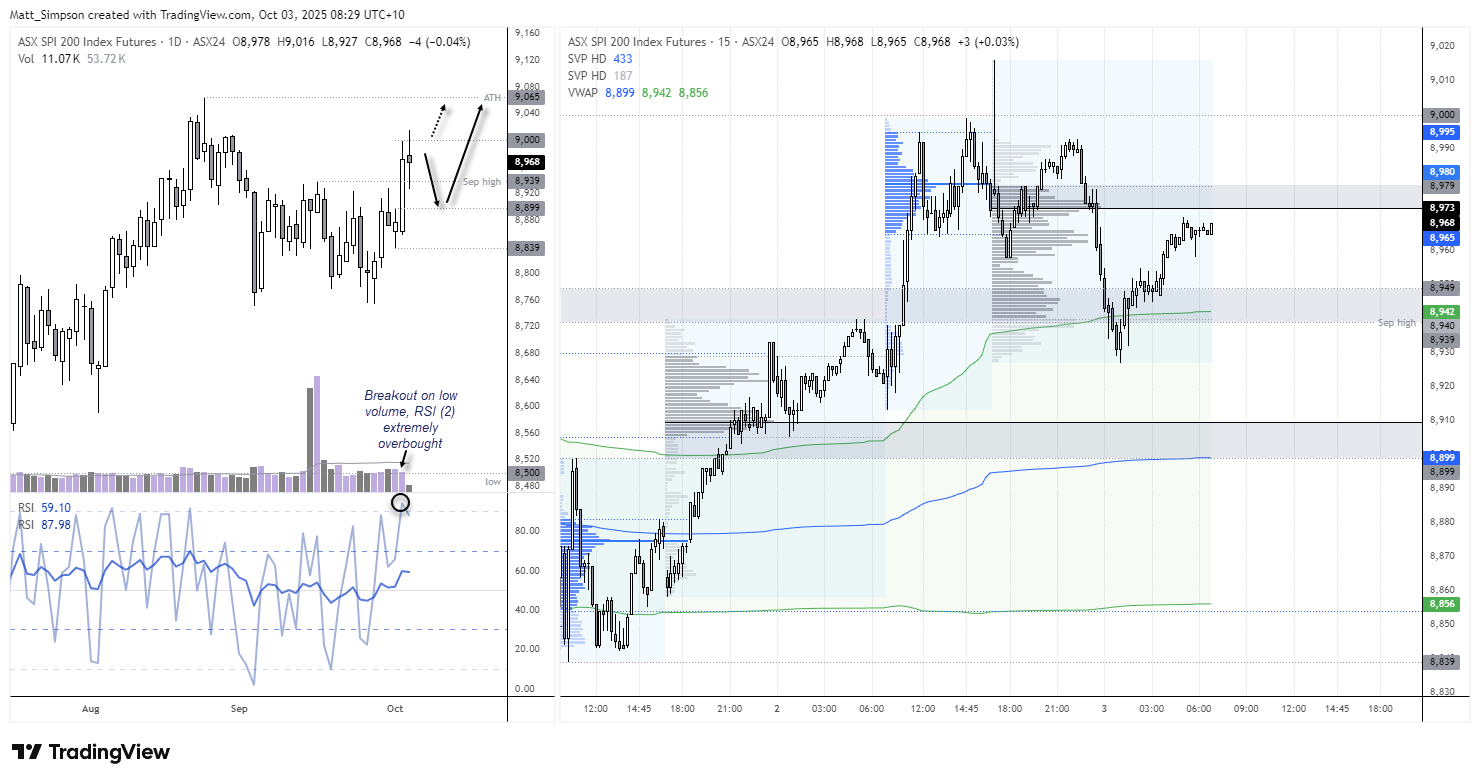
Chart analysis by Matt Simpson - Source: TradingView, ASX SPI 200 Index Futures
View the full economic calendar
View the full economic calendar
-- Written by Matt Simpson
Follow Matt on Twitter @cLeverEdge
How to trade with City Index
You can trade with City Index by following these four easy steps:
- Open an account, or log in if you’re already a customer
• Open an account in the UK
• Open an account in Australia
• Open an account in Singapore
- Search for the market you want to trade in our award-winning platform
- Choose your position and size, and your stop and limit levels
- Place the trade
Related tags:



Open an account in minutes
Experience award-winning platforms with fast and secure execution, and enjoy tight spreads from 0.5 pts on FX and 0.3 pts on indices.
Economic calendar
Web Trader platform
Our sophisticated web-based platform is packed with features.
Related articles

USD/JPY, AUD/JPY: Central Bank Divergence Creates Two-Way Risk
USD/JPY eyes a breakout above 160, while AUD/JPY faces further losses as Fed, RBA and BoJ interest rate expectations diverge.

Nikkei swings harder than Nasdaq as AI fears deepen
Nikkei 225 volatility is running well ahead of Nasdaq 100, with the index construction and Japan's heavy exposure to AI manufacturing potentially explaining the difference.


AUD/USD Bears Tighten Their Grip Into AU Jobs, RBA Minutes
AUD/USD falls below 68 cents as US dollar strength and peak RBA rate expectations put Australian jobs data and RBA minutes in focus.
This report is intended for general circulation only. It should not be construed as a recommendation, or an offer (or solicitation of an offer) to buy or sell any financial products. The information provided does not take into account your specific investment objectives, financial situation or particular needs. Before you act on any recommendation that may be contained in this report, independent advice ought to be sought from a financial adviser regarding the suitability of the investment product, taking into account your specific investment objectives, financial situation or particular needs.
StoneX Financial Pte. Ltd., may distribute reports produced by its respective foreign entities or affiliates within the StoneX group of companies or third parties pursuant to an arrangement under Regulation 32C of the Financial Advisers Regulations. Where the report is distributed to a person in Singapore who is not an accredited investor, expert investor or an institutional investor (as defined in the Securities Futures Act), StoneX Financial Pte. Ltd. accepts legal responsibility to such persons for the contents of the report only to the extent required by law. Singapore recipients should contact StoneX Financial Pte. Ltd. at 6826 9988 for matters arising from, or in connection with the report.
In the case of all other recipients of this report, to the extent permitted by applicable laws and regulations neither StoneX Financial Pte. Ltd. nor its associated companies will be responsible or liable for any loss or damage incurred arising out of, or in connection with, any use of the information contained in this report and all such liability is hereby expressly disclaimed. No representation or warranty is made, express or implied, that the content of this report is complete or accurate.
StoneX Financial Pte. Ltd. is not under any obligation to update this report.
Trading CFDs carries a high level of risk that may not be suitable for some investors. Consider your investment objectives, level of experience, financial resources, risk appetite and other relevant circumstances carefully. The possibility exists that you could lose some or all of your investments, including your initial deposits. If in doubt, please seek independent expert advice. Visit www.forex.com/en-sg/terms-and-policies for the complete Risk Disclosure Statement.