



ASX 200 Morning Market Outlook: ASX Snaps 5-Month Winning Streak
ASX 200 set to end its five-month winning streak as sector weakness and global underperformance weigh. Traders eye near-term signals for direction.
Share this:

The ASX 200 looks set to snap a five-month winning streak — its longest since August 2021. While that episode led to a 16% correction over the following year, this time the setup is more nuanced. The index has lagged global peers such as the S&P 500 and Dow Jones over the past 60 sessions, and end-of-month flows have produced a shooting star candle to warn of near-term weakness. Yet, strong dip-buying interest suggests bulls remain active, with traders now weighing whether consolidation will resolve in a breakout or deeper retracement.
ASX 200 Market Snapshot: Weakness Emerges After Five-Month Rally
- The ASX 200 is on track to snap a five-month winning streak, its longest since August 2021.
- Back then, the index went on to suffer a 16% correction over the following year — whether history repeats or merely rhymes remains to be seen.
- Over the past 60 trading days, the ASX 200 has clearly underperformed global peers such as the Dow Jones and S&P 500.
- End-of-month flows left the ASX 200 cash index with a shooting star candle, signalling potential near-term weakness.
- Nine of eleven sectors declined on Monday, led by Energy and Telecoms, while Materials and Industrials were the only gainers.

Charts prepared by Matt Simpson - data source: ASX, LSEG
View related analysis:
View related analysis:
ASX 200 Technical Analysis
The daily chart shows the ASX 200 trading in a sideways range between ~8750 and 8900 over the past month. Initially, I considered this consolidation to be a choppy wave ‘b’ that required a leg ‘c’ lower. However, the index has held up well, suggesting buyers are willing to step in on dips in anticipation of a bullish breakout. I am now leaning toward the latter scenario.
Monday’s rally into resistance was impressive, and I suspect bulls view the current, albeit shallow, pullback as simply that — a pause within a move that wants to push higher.
On the 4-hour chart, the ASX is holding around a high-volume node (HVN) and trades just above the weekly pivot point (8832). Unless risk appetite turns sharply lower, I am inclined to seek evidence of a swing low, with the expectation of at least a retest of the range highs — and potentially a breakout for pre-emptive bulls.
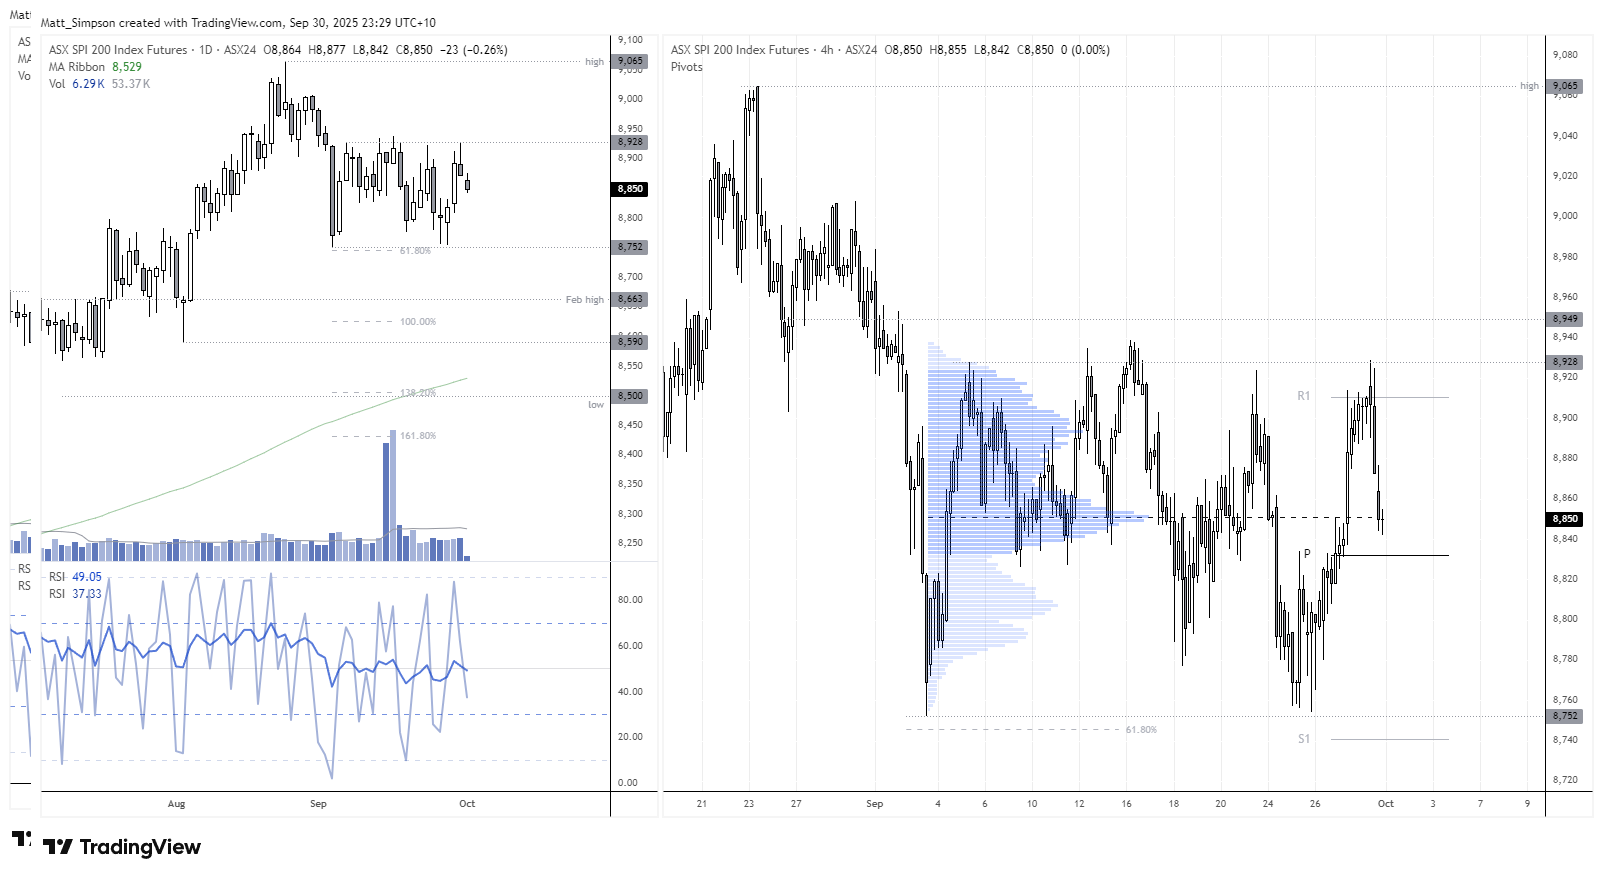
Chart analysis by Matt Simpson - Source: TradingView, ASX SPI 200 Index Futures


Global Index Futures and Asian Market Moves
Asian Indices:
- ASX 200: Fell by -14 points (-0.16%) and currently trades at 8,848.80
- Nikkei 225: Rose by 121.28 points (0.33%) and currently trades at 36,668.23
- Hang Seng: Rose by 232.68 points (0.87%) and currently trades at 26,855.56
- China A50: Fell by -46.7 points (-0.31%) and currently trades at 15,142.31
US index futures:
- Dow Jones Futures: Down -66 points (-0.14%)
- S&P 500 Futures: Down -8.75 points (-0.13%)
- Nasdaq 100 Futures: Down -20.5 points (-0.08%)
View the full economic calendar
View the full economic calendar
-- Written by Matt Simpson
Follow Matt on Twitter @cLeverEdge
How to trade with City Index
You can trade with City Index by following these four easy steps:
- Open an account, or log in if you’re already a customer
• Open an account in the UK
• Open an account in Australia
• Open an account in Singapore
- Search for the market you want to trade in our award-winning platform
- Choose your position and size, and your stop and limit levels
- Place the trade
Related tags:




Open an account in minutes
Experience award-winning platforms with fast and secure execution, and enjoy tight spreads from 0.5 pts on FX and 0.3 pts on indices.
Economic calendar
Web Trader platform
Our sophisticated web-based platform is packed with features.
Related articles

ASX 200 Outlook: A Rates Trade Disguised as a Stock Market?
Australian bond futures have exhibited a far stronger relationship with the ASX 200 than Wall Street over recent months. Now both markets are displaying remarkably similar price structures.


RBA delivers 25bp hike, Bullock now the main event
The RBA delivered the expected 25bp hike, but Bullock’s press conference now looms as the bigger volatility risk for AUD/USD and the ASX 200.

ASX 200 Rebound Stalls Despite Wall Street Surge
The ASX 200 rebound is struggling for traction despite a powerful Wall Street rally, leaving 8800 resistance and downside risks in focus.
This report is intended for general circulation only. It should not be construed as a recommendation, or an offer (or solicitation of an offer) to buy or sell any financial products. The information provided does not take into account your specific investment objectives, financial situation or particular needs. Before you act on any recommendation that may be contained in this report, independent advice ought to be sought from a financial adviser regarding the suitability of the investment product, taking into account your specific investment objectives, financial situation or particular needs.
StoneX Financial Pte. Ltd., may distribute reports produced by its respective foreign entities or affiliates within the StoneX group of companies or third parties pursuant to an arrangement under Regulation 32C of the Financial Advisers Regulations. Where the report is distributed to a person in Singapore who is not an accredited investor, expert investor or an institutional investor (as defined in the Securities Futures Act), StoneX Financial Pte. Ltd. accepts legal responsibility to such persons for the contents of the report only to the extent required by law. Singapore recipients should contact StoneX Financial Pte. Ltd. at 6826 9988 for matters arising from, or in connection with the report.
In the case of all other recipients of this report, to the extent permitted by applicable laws and regulations neither StoneX Financial Pte. Ltd. nor its associated companies will be responsible or liable for any loss or damage incurred arising out of, or in connection with, any use of the information contained in this report and all such liability is hereby expressly disclaimed. No representation or warranty is made, express or implied, that the content of this report is complete or accurate.
StoneX Financial Pte. Ltd. is not under any obligation to update this report.
Trading CFDs carries a high level of risk that may not be suitable for some investors. Consider your investment objectives, level of experience, financial resources, risk appetite and other relevant circumstances carefully. The possibility exists that you could lose some or all of your investments, including your initial deposits. If in doubt, please seek independent expert advice. Visit www.forex.com/en-sg/terms-and-policies for the complete Risk Disclosure Statement.