


ASX 200 Morning Outlook: Bulls Regain Control With Broad Sector Rebound
ASX 200 posts its best session in nearly three weeks, led by IT, Energy and Materials as risk appetite improves.
Share this:

The ASX 200 surged on Monday in its strongest session in almost three weeks, as sentiment improved sharply following positive developments in the U.S. The index opened at its session low and closed at its high, forming a bullish engulfing candle that highlighted renewed risk appetite. Nine of eleven sectors advanced, led by Information Technology (XIJ) and Materials (XMJ) — a complete reversal of Friday’s weakness — while defensive sectors such as Consumer Staples (XSJ) and Real Estate (XRE) lagged.
View related analysis:
- Senate Moves to End Longest U.S. Government Shutdown in History
- Australian Dollar Outlook: RBA Hold Puts Focus on AU Jobs, US CPI
- ASX 200 Morning Outlook: Bulls Seek Support After Second Weekly Decline
- ASX 200 Morning Outlook: Commodities Bounce Helps Materials Lead Gains
- ASX 200 Morning Outlook: Buyers Test Support as BHP and WOW Stabilise
View related analysis:
- Senate Moves to End Longest U.S. Government Shutdown in History
- Australian Dollar Outlook: RBA Hold Puts Focus on AU Jobs, US CPI
- ASX 200 Morning Outlook: Bulls Seek Support After Second Weekly Decline
- ASX 200 Morning Outlook: Commodities Bounce Helps Materials Lead Gains
- ASX 200 Morning Outlook: Buyers Test Support as BHP and WOW Stabilise
ASX 200 Market Snapshot
- Sentiment was buoyant on Monday on news the US senate had agreed on a bill to cease the government shutdown
- The ASX 200 enjoyed its best trading day in 18 and formed a bullish engulfing day which opened at the session low and closed at its daily high
- 9 of its 11 sectors advancing, with 134 stocks rising, 51 declining and 15 remaining flat
- Information technology (XIJ) and materials (XMJ) led the ASX higher, which was a complete reversal of Friday’s bearish price action
- Consumer staples (XSJ) and Real Estate (XRE) were the two sectors that declined
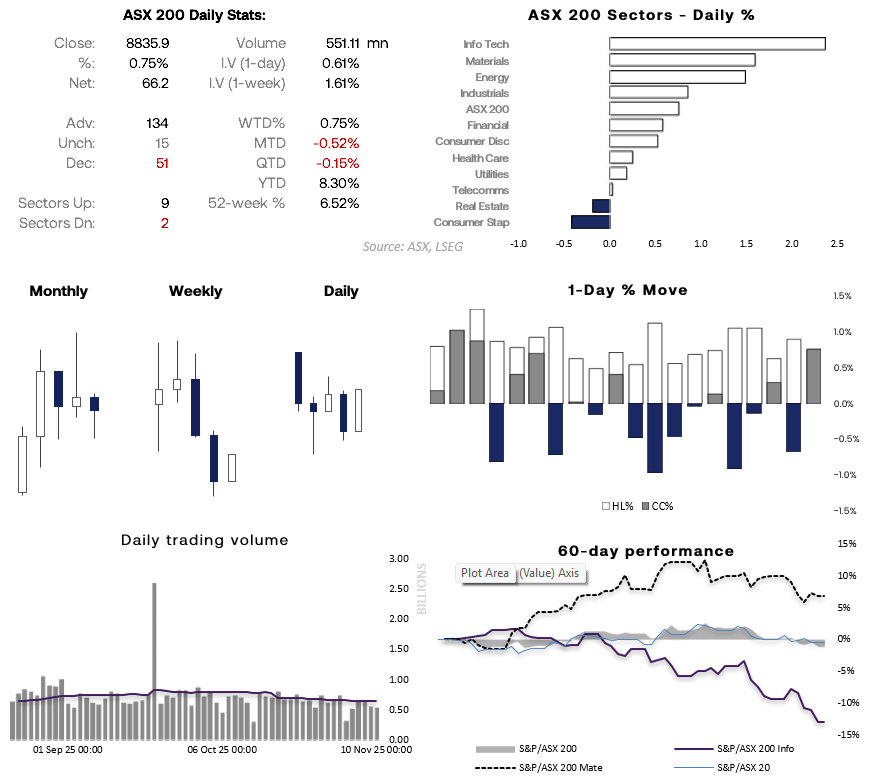
Chart analysis by Matt Simpson - source: ASX, LSEG


ASX 200 Sector Technical Outlook
Energy Sector (XEJ): Momentum Builds Despite Softer Crude
The ASX 200 Energy sector (XEJ) rose for a third consecutive week despite crude oil prices trading slightly lower. The sector also extended gains for a third straight day on Monday, reaching a 37-day high.

Chart analysis by Matt Simpson - source: ASX, TradingView
- Woodside Energy (WDS) – the largest stock in the energy sector – closed above $26 to mark a nine-week high and now trades just 1% below its September peak. With both the daily RSI (2) and RSI (14) overbought and resistance approaching, the stock could soon meet resistance — at least in the near term.
- Whitehaven Coal (WHC) is attempting a break above last week’s high, though the choppy nature of recent price action on the daily chart raises the risk of a false break and reversal lower. Also note the spinning top doji candle last week, which was only marginally higher than the shooting star seen at the August high.
- Santos Limited (STO) remains confined within a tight range amid bearish consolidation. While a short-term move higher is possible, it could simply prove a minor correction against the sharp -23.3% decline from the September high to the October low.
Information Technology Sector (XIJ): Signs of a Near-Term Cycle Low
The Information Technology sector (XIJ) rose 2.4% in its best session in 10 weeks, forming a two-bar bullish reversal pattern known as a dark cloud cover. With both the daily RSI (2) and RSI (14) having reached oversold territory on Friday — and given the scale of the recent selloff — a near-term cycle low may be forming.
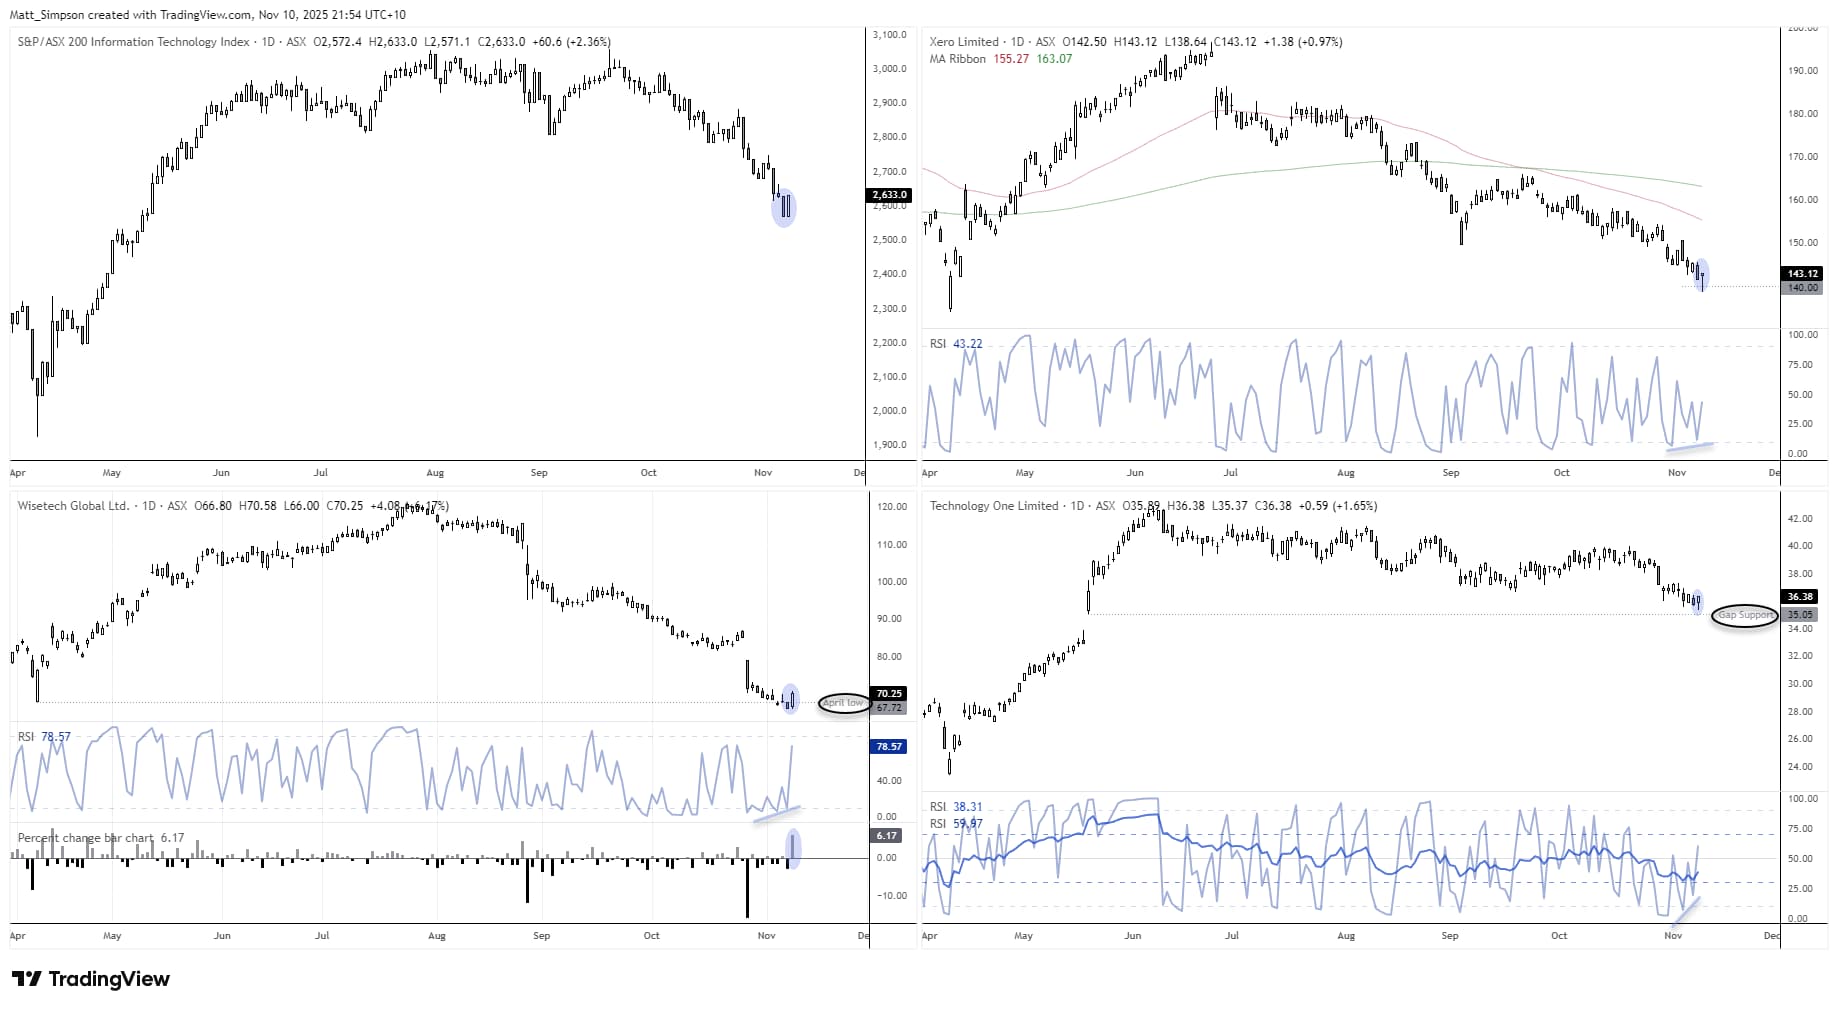
Chart analysis by Matt Simpson - source: ASX, TradingView
- Xero Ltd (XRO) printed a one-day bullish reversal candle known as a shooting star. Daily volume was above average and reached a six-day high, suggesting a potential swing low around $140. Its weekly RSI (2) also hit its most oversold level in 31 weeks last week.
- Wisetech Global (WTC) jumped 6.2% in its strongest day in six months. Given its firm daily close back above the April low, alongside a multi-week bullish RSI (2) divergence on the weekly chart, it reinforces the case for a near-term cycle low within the technology sector.
- Technology One (TNE) formed a bullish outside day just above upper gap support at $35.05, hinting at a near-term swing low. A multi-week bullish divergence has also emerged, adding weight to the recovery scenario.


Healthcare Sector (XHJ): Oversold Conditions Hint at a Bounce
Healthcare (XHJ) is another sector showing oversold conditions. After falling -8% two weeks ago, last week’s narrow range suggests bears are losing momentum above the 2023 low. Prices are consolidating within a tight band on the daily chart, and the longer they hold above recent lows, the greater the odds of a short-term pop higher.
- CSL Limited (CSL) not only mirrors the broader sector but effectively defines it. A small inside week formed near its 16-month low last week, following the -27% decline seen the week prior. While investors may not be rushing to buy at these levels, bears should tread carefully to avoid getting caught short during a countertrend bounce. CSL still has scope to retest its recent low near 158.43, though a rebound may occur first.
ASX 200 Technical Analysis
A bullish engulfing candle formed at the September low, marking the second false intraday break around that key level. The pattern closed above both the 100-day SMA and EMA, as well as the 8862 swing low. Notably, the ASX 200 also shows a bullish divergence on the daily RSI (2) leading into the recent swing low.
Upside targets for bulls sit around 8950 and 9000, though caution is warranted as a lower high could form near those resistance zones — consistent with bearish signals seen on higher-timeframe charts and across several sectors.
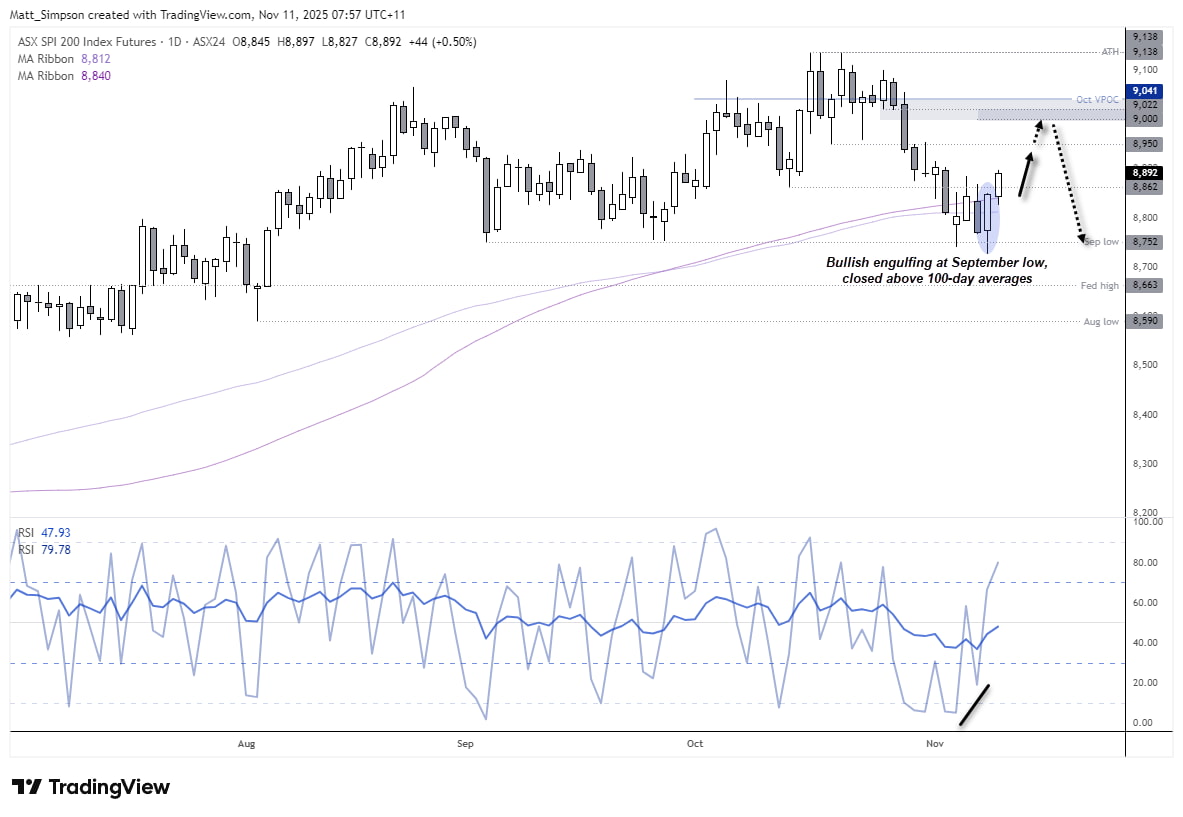
Chart analysis by Matt Simpson - Source: TradingView, ASX SPI 200 Index Futures
View the full economic calendar
View the full economic calendar
-- Written by Matt Simpson
Follow Matt on Twitter @cLeverEdge
How to trade with City Index
You can trade with City Index by following these four easy steps:
- Open an account, or log in if you’re already a customer
• Open an account in the UK
• Open an account in Australia
• Open an account in Singapore
- Search for the market you want to trade in our award-winning platform
- Choose your position and size, and your stop and limit levels
- Place the trade
Related tags:




Open an account in minutes
Experience award-winning platforms with fast and secure execution, and enjoy tight spreads from 0.5 pts on FX and 0.3 pts on indices.
Economic calendar
Web Trader platform
Our sophisticated web-based platform is packed with features.
Related articles
Australian Dollar Outlook: AUD/USD Screams Sentiment Extreme Into Fed, CPI
AUD/USD rebounds despite record bearish futures positioning, with Australian Q3 CPI and the Fed meeting threatening to trigger another short squeeze.

S&P 500 forecast: AI linked stocks remain under pressure
And just like that, it is Friday again and the end of a volatile week. Today offers little on the macro calendar to change the prevailing narrative, leaving markets largely at the mercy of risk appetite, oil prices and the growing unease around the AI trade.


USD/JPY, Nikkei Break Lower as AI Meltdown Spreads
Thursday’s tech tantrum has become Friday’s fire sale. With Nikkei support giving way and the yen strengthening, could the selling start feeding on itself?

This report is intended for general circulation only. It should not be construed as a recommendation, or an offer (or solicitation of an offer) to buy or sell any financial products. The information provided does not take into account your specific investment objectives, financial situation or particular needs. Before you act on any recommendation that may be contained in this report, independent advice ought to be sought from a financial adviser regarding the suitability of the investment product, taking into account your specific investment objectives, financial situation or particular needs.
StoneX Financial Pte. Ltd., may distribute reports produced by its respective foreign entities or affiliates within the StoneX group of companies or third parties pursuant to an arrangement under Regulation 32C of the Financial Advisers Regulations. Where the report is distributed to a person in Singapore who is not an accredited investor, expert investor or an institutional investor (as defined in the Securities Futures Act), StoneX Financial Pte. Ltd. accepts legal responsibility to such persons for the contents of the report only to the extent required by law. Singapore recipients should contact StoneX Financial Pte. Ltd. at 6826 9988 for matters arising from, or in connection with the report.
In the case of all other recipients of this report, to the extent permitted by applicable laws and regulations neither StoneX Financial Pte. Ltd. nor its associated companies will be responsible or liable for any loss or damage incurred arising out of, or in connection with, any use of the information contained in this report and all such liability is hereby expressly disclaimed. No representation or warranty is made, express or implied, that the content of this report is complete or accurate.
StoneX Financial Pte. Ltd. is not under any obligation to update this report.
Trading CFDs carries a high level of risk that may not be suitable for some investors. Consider your investment objectives, level of experience, financial resources, risk appetite and other relevant circumstances carefully. The possibility exists that you could lose some or all of your investments, including your initial deposits. If in doubt, please seek independent expert advice. Visit www.forex.com/en-sg/terms-and-policies for the complete Risk Disclosure Statement.