






ASX 200 teases bears with a potential swing high
The ASX 200 looks like it could be setting up for a dip lower, but whether it is a big or small dip is likely down to whether Wall Street holds above its December lows.
Share this:

It was not a bad year for the ASX 200 with its 7.4% gain, this is less than half of its low-to-high range of over 15%. Price action on the monthly chart also shows a few twists and turns along the way, even if it managed to hold above its 20-month EMA and close firmly above its 10-mont EMA. However, December’s bearish engulfing month for December at its record high stands out, and this has me on guard for another dip lower.
ASX 200 futures (SPI 200) technical analysis
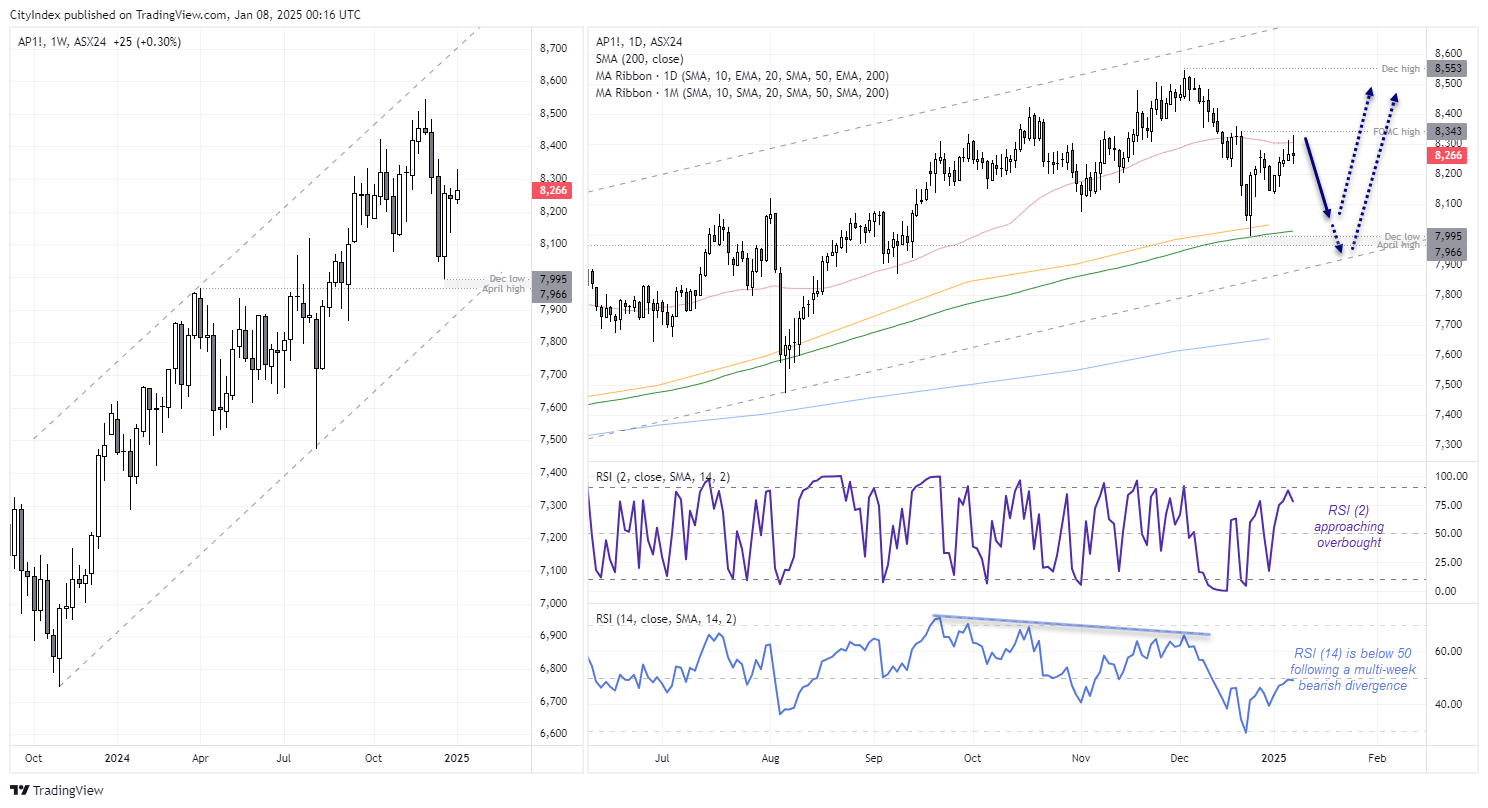
The weekly chart shows the ASX 200 trades within a strong bullish channel, although it could still allow for some further downside and retest of its lower trendline before the bullish trend resumes. The April high and December low land between 7699 – 7995 for potential support, should losses arrive hard and fast.
The daily chart shows a 3-wave move from the December low, although the third leg is losing bullish momentum. Two small shooting stars have also formed, and if prices are to close around current levels today then we’ll have a third. Also note that prices are struggling to hold above the 50-day SMA or retest the FOMC high. And given the multi-week bearish RSI (14) divergence and the fact that the daily RSI (2) is approaching overbought only adds to the case for a swing high to form.
Bears could seek to fade into moves towards the FOMC high with a view to initially target the 8100 handle and 200-day SMA near the 8000 handle. Although a potentially supporting factor for bears to mull over is that Wall Street indices are holding above their post-FOMC lows from December 18th.
For now, I suspect we’re in for at least a cheeky swing lower. But buyers could be lurking around the 200-day SMA or lower trendline. And as a Trump presidency favours a higher Wall Street, the ASX 200 could eventually rally higher as well.
View the full economic calendar
View the full economic calendar
-- Written by Matt Simpson
Follow Matt on Twitter @cLeverEdge
How to trade with City Index
You can trade with City Index by following these four easy steps:
- Open an account, or log in if you’re already a customer
• Open an account in the UK
• Open an account in Australia
• Open an account in Singapore
- Search for the market you want to trade in our award-winning platform
- Choose your position and size, and your stop and limit levels
- Place the trade
Related tags:
Latest market news




Open an account in minutes
Experience award-winning platforms with fast and secure execution, and enjoy tight spreads from 0.5 pts on FX and 0.3 pts on indices.
Economic calendar
Web Trader platform
Our sophisticated web-based platform is packed with features.
Related articles

US Dollar Technical Outlook: DXY Bulls Meet Resistance at Yearly Highs 10 1 2026
The U.S. Dollar has held firm despite fading Fed hike bets, but Friday’s payrolls could test the rally’s staying power.


Dow Jones forecast: Stock markets under pressure from multiple sources
When looking at the major tech-heavy US indices like the S&P 500 or the Nasdaq 100, you wouldn’t think that the stock market is particularly weak. Yet, beneath the surface, the market is far from healthy right now. Investors are evidently just piling into the big tech and AI names, and as a result, market breadth is deteriorating. Other indices like the small cap Russell 2000 and the Dow Jones are starting to reflect that weakness.


Nikkei breakout accelerates as yen weakness returns
Nikkei has started October with a powerful breakout, helped by renewed yen weakness and strong upside momentum

This report is intended for general circulation only. It should not be construed as a recommendation, or an offer (or solicitation of an offer) to buy or sell any financial products. The information provided does not take into account your specific investment objectives, financial situation or particular needs. Before you act on any recommendation that may be contained in this report, independent advice ought to be sought from a financial adviser regarding the suitability of the investment product, taking into account your specific investment objectives, financial situation or particular needs.
StoneX Financial Pte. Ltd., may distribute reports produced by its respective foreign entities or affiliates within the StoneX group of companies or third parties pursuant to an arrangement under Regulation 32C of the Financial Advisers Regulations. Where the report is distributed to a person in Singapore who is not an accredited investor, expert investor or an institutional investor (as defined in the Securities Futures Act), StoneX Financial Pte. Ltd. accepts legal responsibility to such persons for the contents of the report only to the extent required by law. Singapore recipients should contact StoneX Financial Pte. Ltd. at 6826 9988 for matters arising from, or in connection with the report.
In the case of all other recipients of this report, to the extent permitted by applicable laws and regulations neither StoneX Financial Pte. Ltd. nor its associated companies will be responsible or liable for any loss or damage incurred arising out of, or in connection with, any use of the information contained in this report and all such liability is hereby expressly disclaimed. No representation or warranty is made, express or implied, that the content of this report is complete or accurate.
StoneX Financial Pte. Ltd. is not under any obligation to update this report.
Trading CFDs carries a high level of risk that may not be suitable for some investors. Consider your investment objectives, level of experience, financial resources, risk appetite and other relevant circumstances carefully. The possibility exists that you could lose some or all of your investments, including your initial deposits. If in doubt, please seek independent expert advice. Visit www.forex.com/en-sg/terms-and-policies for the complete Risk Disclosure Statement.