







AUD and ASX 200 Surge into RBA with Guidance in the Crosshairs
The RBA’s rate cut looks locked in, but the real test for markets will come via its outlook. Any resistance to expectations for more easing could see the Australian dollar push higher, with the ASX 200’s rally potentially taking a breather.
Share this:

- Wall Street bounce boosts AUD and ASX 200
- RBA cut fully priced, focus shifts to guidance
- Hawkish tone could lift AUD, weigh on equities
- AUD/USD testing key 200DMA with bullish signals
- ASX 200 momentum remains strong, 8400 key resistance
Summary
A sharp decline in U.S. Treasury yields, reversing earlier gains, helped spark a recovery in risk appetite on Wall Street, delivering strong tailwinds for cyclical assets like the Australian dollar and ASX 200. With a 25 basis point rate cut from the Reserve Bank of Australia (RBA) fully priced for later today, whether those gains are sustained, extended or unwound may hinge on the guidance the bank offers on the rate outlook. On that front, a hawkish tone relative to market pricing looks the more likely outcome.
RBA Forecasts Key for AUD, ASX
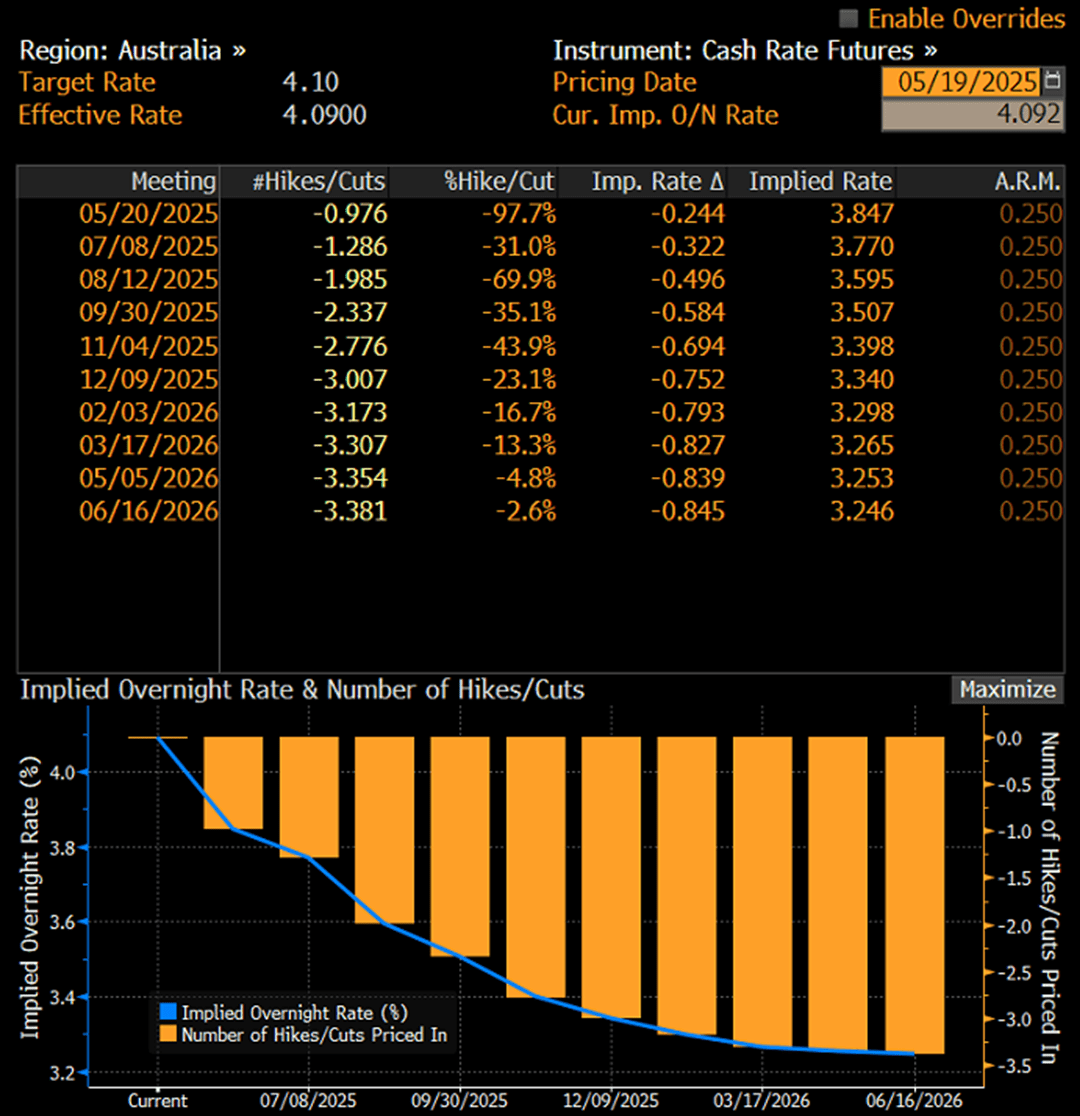
As seen in the Bloomberg graphic below showing implied probabilities from AUD swaps markets, a 25bp cut is about as close to locked in as it gets without being fully priced. With 97.7% probability assigned and no major shocks expected, market reaction will likely centre on the tone of the RBA's policy statement and updated forecasts.
Source: Bloomberg
The RBA’s last set of forecasts, released in February, are shown below. For GDP, the bank’s 2% year-ended growth call for June 2025 may be revised slightly lower following soft household consumption in Q1. With the unemployment rate holding steady at 4.1% last month, there’s likely little need for near-term tweaks to labour market forecasts.
Source: RBA
Given the RBA’s dual mandate of full employment and low and stable inflation, the greatest interest may come from its updated trimmed mean inflation profile. Back in February when the easing cycle began, the bank’s inflation forecasts didn’t show a return to the midpoint of the 2–3% target band, warning that too many cuts were priced for it to hit its mandate.
Source: TradingView
Fast forward to today and even more easing is priced in than when those forecasts were made, suggesting that rather than being revised lower, the bank’s inflation projections may stay unchanged—or even edge higher. Yes, uncertainty remains high and crude oil prices have dropped further than expected, but don’t be surprised if the RBA pushes back on current pricing, which sees two additional cuts beyond today.
If that materialises, it could lift the Australian dollar while taking some heat out of the ASX 200.
AUD/USD Battle at 200DMA Resumes
Source: TradingView
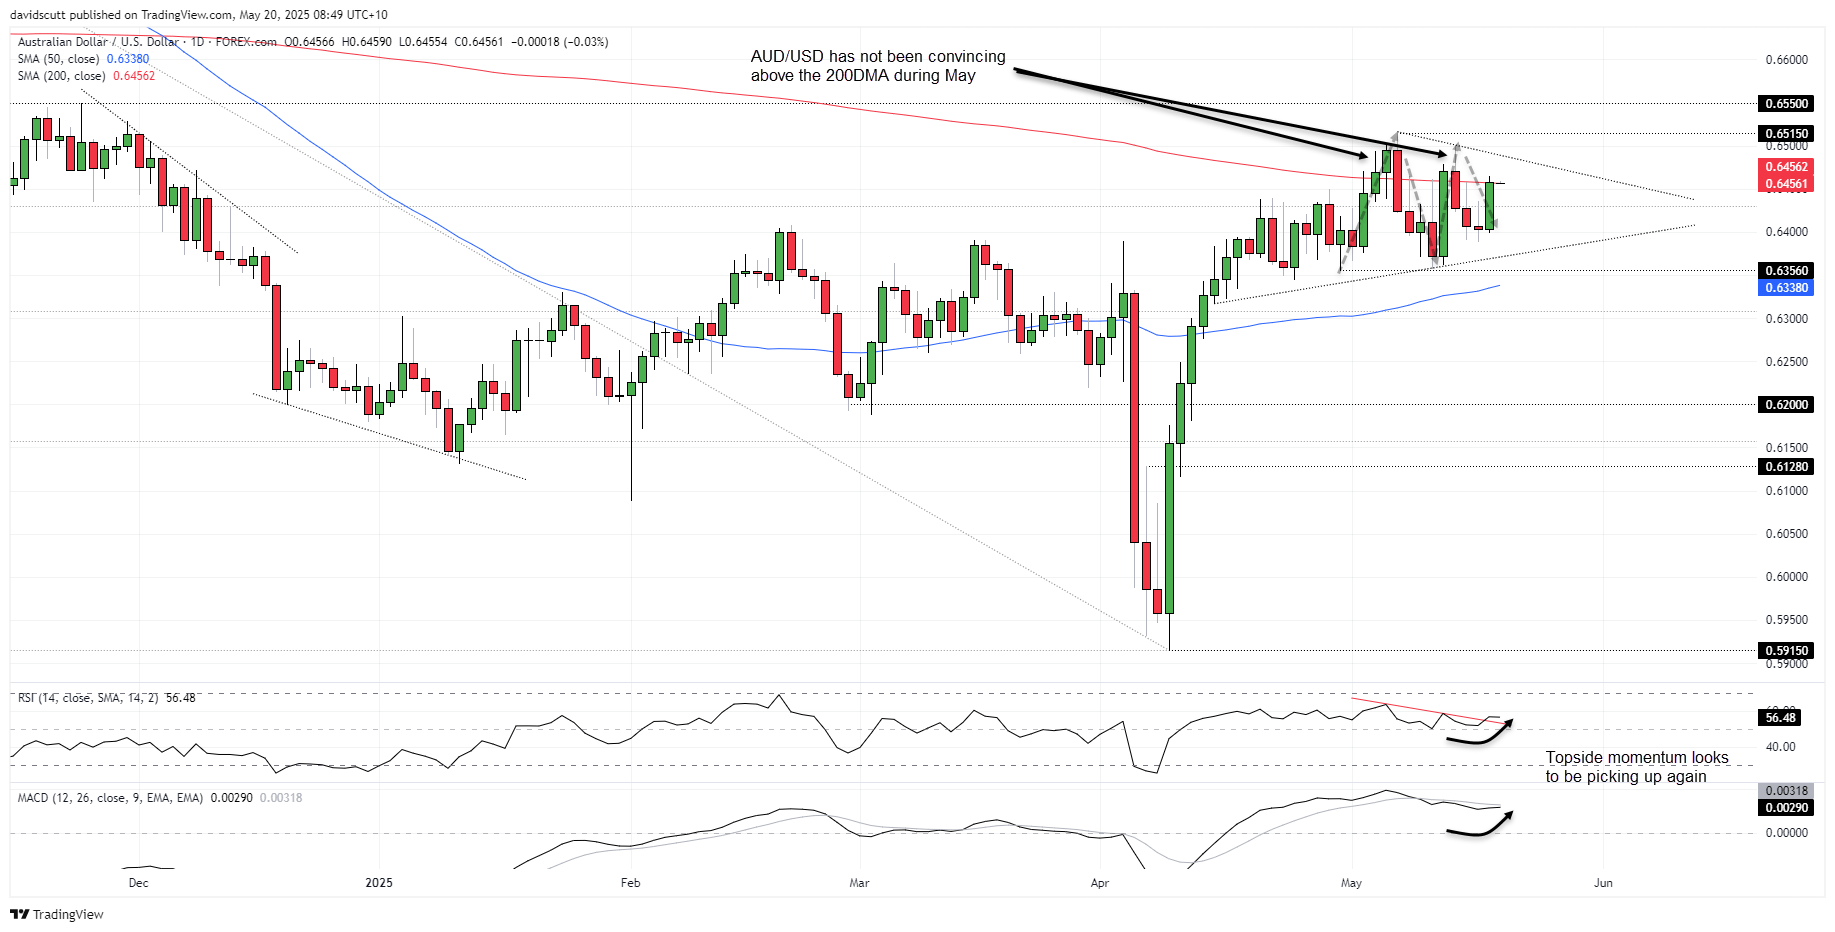
AUD/USD finds itself testing the key 200DMA early in the Asian session, a level it’s failed to break convincingly above in May. While Monday’s three-candle morning star pattern hints at upside, the signal is weaker given the lack of a sustained downtrend beforehand. Still, with RSI (14) and MACD indicators turning higher, this test of the 200DMA may have more legs. Zooming out, AUD/USD also appears to be forming a bull pennant—a continuation pattern that warns of an eventual resumption of the prior bullish trend
Above the 200DMA, resistance sits between .6500 and .6515, with .6550 the next level of note if cleared. Below, watch for support to emerge under .6400 and at .6356, the latter a level that held repeatedly earlier this month. The 50DMA is another key downside level to monitor.
ASX 200 SPI Futures Deliver Bullish Signal
Source: TradingView
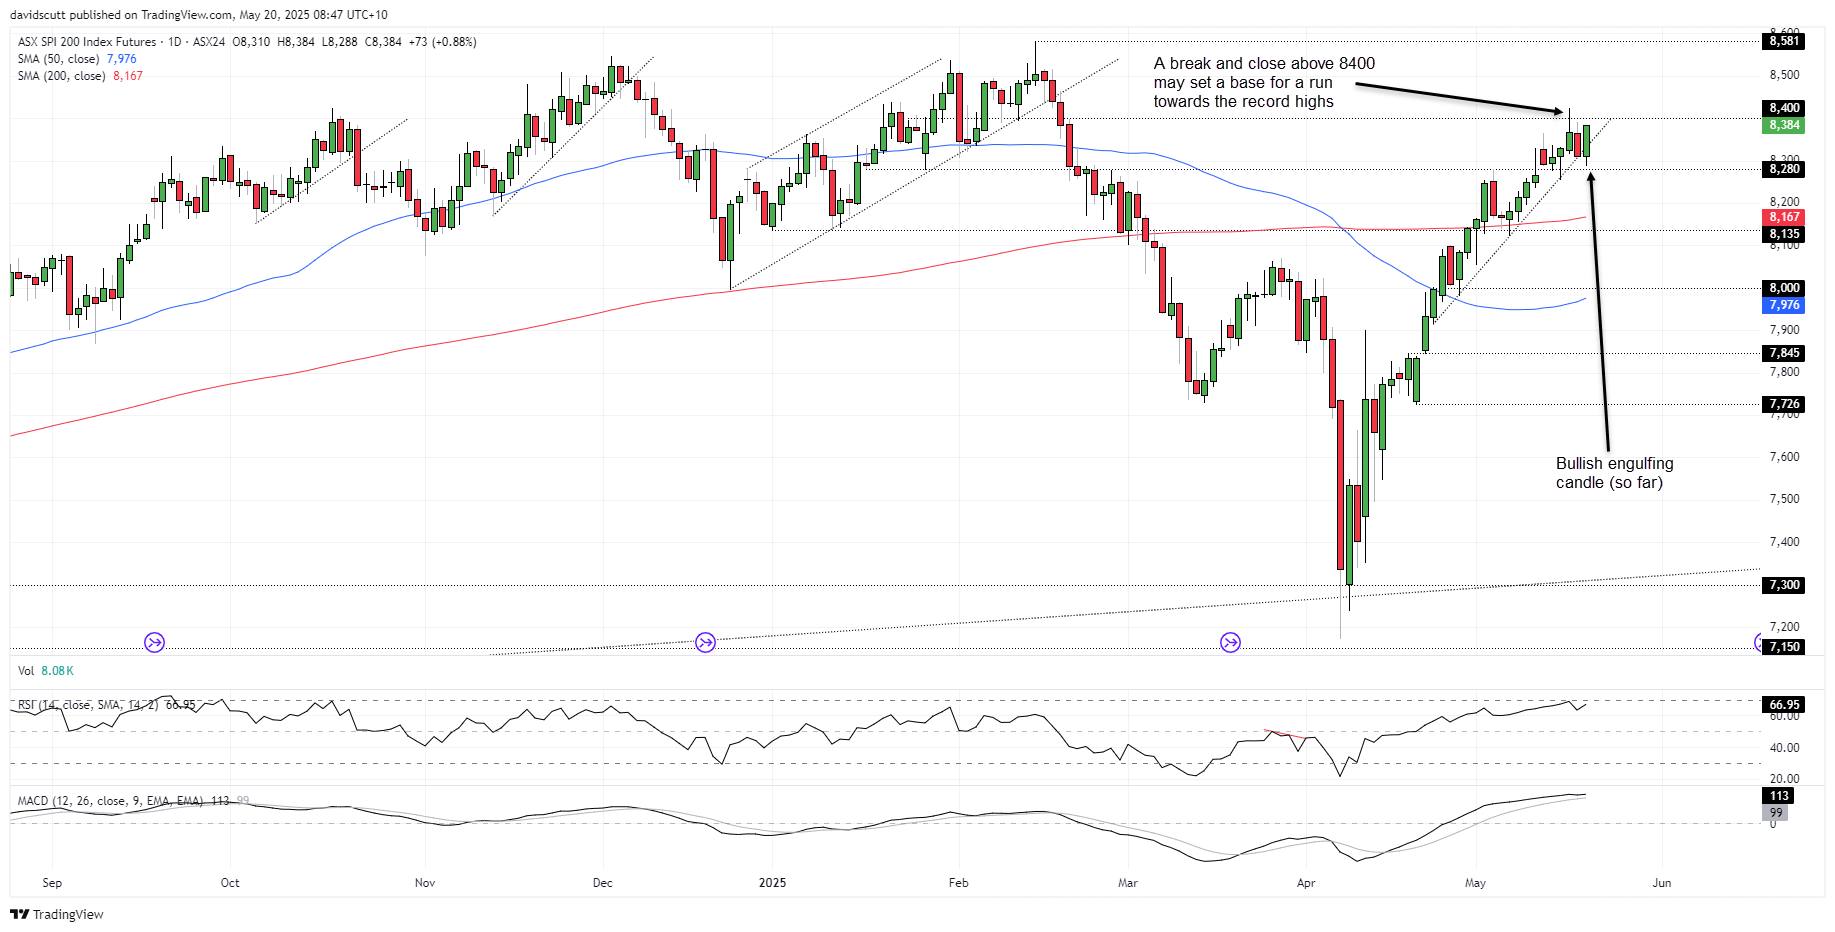
The rally in ASX 200 SPI futures off the April lows remains relentless, with another downside break of uptrend support failing in the overnight session, producing a bullish engulfing candle that warns of further upside if sustained during Tuesday's day session.
8400 is the key near-term resistance, having capped the index last week. A sustained break above could invite more bulls to chase a retest of the former record highs at 8581. On the downside, 8280 remains critical support. A break and close below would increase the risk of a return to the 200DMA.
Given the price action and momentum backdrop, dip buying may continue to be more rewarding than fading the broader rally.
-- Written by David Scutt
Follow David on Twitter @scutty
How to trade with City Index
You can trade with City Index by following these four easy steps:
- Open an account, or log in if you’re already a customer
• Open an account in the UK
• Open an account in Australia
• Open an account in Singapore
- Search for the market you want to trade in our award-winning platform
- Choose your position and size, and your stop and limit levels
- Place the trade

Open an account in minutes
Experience award-winning platforms with fast and secure execution, and enjoy tight spreads from 0.5 pts on FX and 0.3 pts on indices.
Economic calendar
Web Trader platform
Our sophisticated web-based platform is packed with features.
Related articles

USD/JPY weekly outlook: Quarter turn scrambles rates regime
USD/JPY’s tight relationship with front-end US rates broke down sharply last week, but quarter-turn flows and positioning suggest the disconnect may prove temporary.

USD/CAD forecast: rally could accelerate above June highs at 1.4250
USD/CAD recovered quickly after weaker US jobs data, keeping the bullish trend in focus. A move above the June highs could accelerate the rally as inflation keeps the Fed under pressure.


USD Sets Fresh Yearly High as EUR/USD Drops Dramatically, USD/JPY Stable
Well, it was a week of USD strength that wasn’t entirely pushed by USD/JPY, as a strong sell-off in EUR/USD has pushed the major pair to its most oversold state in a decade.
This report is intended for general circulation only. It should not be construed as a recommendation, or an offer (or solicitation of an offer) to buy or sell any financial products. The information provided does not take into account your specific investment objectives, financial situation or particular needs. Before you act on any recommendation that may be contained in this report, independent advice ought to be sought from a financial adviser regarding the suitability of the investment product, taking into account your specific investment objectives, financial situation or particular needs.
StoneX Financial Pte. Ltd., may distribute reports produced by its respective foreign entities or affiliates within the StoneX group of companies or third parties pursuant to an arrangement under Regulation 32C of the Financial Advisers Regulations. Where the report is distributed to a person in Singapore who is not an accredited investor, expert investor or an institutional investor (as defined in the Securities Futures Act), StoneX Financial Pte. Ltd. accepts legal responsibility to such persons for the contents of the report only to the extent required by law. Singapore recipients should contact StoneX Financial Pte. Ltd. at 6826 9988 for matters arising from, or in connection with the report.
In the case of all other recipients of this report, to the extent permitted by applicable laws and regulations neither StoneX Financial Pte. Ltd. nor its associated companies will be responsible or liable for any loss or damage incurred arising out of, or in connection with, any use of the information contained in this report and all such liability is hereby expressly disclaimed. No representation or warranty is made, express or implied, that the content of this report is complete or accurate.
StoneX Financial Pte. Ltd. is not under any obligation to update this report.
Trading CFDs carries a high level of risk that may not be suitable for some investors. Consider your investment objectives, level of experience, financial resources, risk appetite and other relevant circumstances carefully. The possibility exists that you could lose some or all of your investments, including your initial deposits. If in doubt, please seek independent expert advice. Visit www.forex.com/en-sg/terms-and-policies for the complete Risk Disclosure Statement.