







AUD/JPY Risks Breakdown as Momentum Fades Below 95.00 Resistance
The Australian dollar is under pressure against the Japanese yen as bullish momentum stalls near key resistance, highlighting downside risks for AUD/JPY.
Share this:
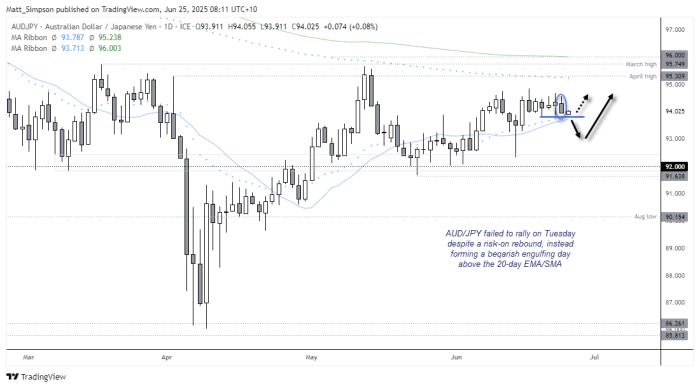
The Australian dollar is struggling to maintain upward momentum against the Japanese yen, with AUD/JPY failing to follow through on a bullish setup despite a broader risk-on rebound. After carving out a bullish hammer and range expansion above 92.00 last week, bulls were eyeing a move toward 95.50 and 96.00. Yet, recent price action has turned cautious. Tuesday’s bearish engulfing candle and a failure to hold gains above the 20-day EMA and SMA suggest bearish pressure is building. A downside break beneath 93.70 could expose deeper support levels as short-term sentiment shifts.
View related analysis:
View related analysis:
AUD/JPY Technical Analysis: Australian Dollar vs Japanese Yen
Last week, I outlined a bullish bias for AUD/JPY, targeting a move towards 95.50 and 96.00. The bullish hammer above 92.00 and subsequent bullish range expansion day looked promising—especially with an inverted head and shoulders (H&S) pattern forming on the 1-hour chart. However, four days later, bullish momentum has failed to follow through, and Japanese yen bears may now have a slight upper hand over the Australian dollar.
The daily chart for AUD/JPY shows a small bearish engulfing candle forming on Tuesday, following a wide-legged Doji that signalled elevated volatility within the recent sideways range. This pattern has ultimately resolved with a dip lower. The failure of AUD/JPY to rally during a broader risk-on rebound also raises a red flag, and puts a potential downside break firmly on the radar.
A break beneath 93.70 would see prices beneath its recent range and also clear the 20-day SMA and EMA to suggest a countertrend move is on the cards.
AUD/JPY Technical Analysis: 1-Hour Chart
The 1-hour chart shows AUD/JPY has been oscillating between the 93.80–94.75 zone over the past week. Prices have drifted toward the lower bounds of that range, though AUD/JPY is attempting to carve out a swing low above the 38.2% Fibonacci retracement level.
Given the 1-hour RSI (2) reached an extremely oversold reading of 3.2 overnight, the bias is for a minor bounce before prices potentially break lower from the range. Bears could look to fade into intraday rallies if a swing high appears to form on the 1-hour chart.

Economic Events in Focus (AEST / GMT+10)
08:00 NZD Trade Balance (May), Exports, Imports (NZD/USD, NZX 50)
09:50 JPY BoJ Summary of Opinions, Corporate Services Price Index (CSPI) (YoY) (USD/JPY, Nikkei 225)
10:15 USD Fed Schmid Speaks (USD, S&P 500, Nasdaq 100, Dow Jones, Gold, Crude Oil)
11:00 JPY BoJ Tamura Speaks (USD/JPY, Nikkei 225)
11:30 AUD Weighted Mean CPI (YoY) (May) (AUD/USD, ASX 200)
14:00 GBP Car Registration (MoM, YoY) (May) (GBP/USD, FTSE 100)
14:00 EUR German Car Registration (MoM, YoY) (May) (EUR/USD, DAX)
15:00 JPY Leading Index, Coincident Indicator (Apr) (USD/JPY, Nikkei 225)
18:00 CHF ZEW Expectations (Jun) (USD/CHF, SMI)
19:00 GBP 15-Year Treasury Gilt Auction (GBP/USD, FTSE 100)
21:00 USD MBA Mortgage Applications, Refinance Index, Purchase Index, Market Index, 30-Year Mortgage Rate (USD, S&P 500, Nasdaq 100, Dow Jones)
22:30 USD Building Permits (May) (USD, S&P 500, Nasdaq 100, Dow Jones, Gold, Crude Oil)
23:00 CHF SNB Quarterly Bulletin (USD/CHF, SMI)
00:00 USD Fed Chair Powell Testifies, New Home Sales (May) (USD, S&P 500, Nasdaq 100, Dow Jones)
00:30 USD Crude Oil Inventories, EIA Stockpiles, Refinery Runs, Gasoline & Heating Oil Data (USD, Crude Oil, S&P 500)
01:00 CAD Budget Balance (Apr) (USD/CAD, TSX)
02:00 USD 5-Year Note Auction (USD, Treasury Market)
Related tags:



Open an account in minutes
Experience award-winning platforms with fast and secure execution, and enjoy tight spreads from 0.5 pts on FX and 0.3 pts on indices.
Economic calendar
Web Trader platform
Our sophisticated web-based platform is packed with features.
Related articles

USD/JPY Forecast: Is Rising Japanese Inflation Supporting the Yen?
As the trading week comes to an end, one of the most relevant developments in the FX market has been the renewed strength of the Japanese yen. This can be seen in the recent performance of USD/JPY, which has fallen nearly 1.0% over the last two trading sessions, highlighting a meaningful recovery in the Japanese currency against the U.S. dollar.


Silver forecast: metals liquidation drags XAG/USD into $50-55 support
Silver has broken its July low and slipped into a long-term support zone as the selling in precious metals deepens. The chart shows where the metal could bottom, and next week's Fed decision may decide whether it does.


Australian Dollar Forecast: AUD/USD Support Reversal Sparks Monthly Range Breakout 10 23 2026
A sharp reversal off key support has fueled the AUD/USD recovery, with resistance now in focus ahead of next week’s Fed decision and Australian CPI.
This report is intended for general circulation only. It should not be construed as a recommendation, or an offer (or solicitation of an offer) to buy or sell any financial products. The information provided does not take into account your specific investment objectives, financial situation or particular needs. Before you act on any recommendation that may be contained in this report, independent advice ought to be sought from a financial adviser regarding the suitability of the investment product, taking into account your specific investment objectives, financial situation or particular needs.
StoneX Financial Pte. Ltd., may distribute reports produced by its respective foreign entities or affiliates within the StoneX group of companies or third parties pursuant to an arrangement under Regulation 32C of the Financial Advisers Regulations. Where the report is distributed to a person in Singapore who is not an accredited investor, expert investor or an institutional investor (as defined in the Securities Futures Act), StoneX Financial Pte. Ltd. accepts legal responsibility to such persons for the contents of the report only to the extent required by law. Singapore recipients should contact StoneX Financial Pte. Ltd. at 6826 9988 for matters arising from, or in connection with the report.
In the case of all other recipients of this report, to the extent permitted by applicable laws and regulations neither StoneX Financial Pte. Ltd. nor its associated companies will be responsible or liable for any loss or damage incurred arising out of, or in connection with, any use of the information contained in this report and all such liability is hereby expressly disclaimed. No representation or warranty is made, express or implied, that the content of this report is complete or accurate.
StoneX Financial Pte. Ltd. is not under any obligation to update this report.
Trading CFDs carries a high level of risk that may not be suitable for some investors. Consider your investment objectives, level of experience, financial resources, risk appetite and other relevant circumstances carefully. The possibility exists that you could lose some or all of your investments, including your initial deposits. If in doubt, please seek independent expert advice. Visit www.forex.com/en-sg/terms-and-policies for the complete Risk Disclosure Statement.