









Crude Oil Crashes as Iran's Muted Response Fuels Wall Street Rebound
Oil prices plunge over 10% in a single session as Iran’s restrained retaliation eases geopolitical fears, boosting risk appetite and Wall Street futures.
Share this:

WTI crude oil collapsed more than 10% on Monday in one of its sharpest selloffs in decades, as Iran’s long-awaited retaliation against the U.S. turned out to be surprisingly restrained. After weeks of escalating fears, the muted response from Tehran has cast doubt on the likelihood of a broader conflict — helping shift market sentiment back toward monetary policy and risk assets. Traders are now re-evaluating prospects for Fed rate cuts and a Wall Street rebound, with the S&P 500 and Nasdaq 100 flashing bullish reversal signals to start the week.
View related analysis:
View related analysis:
Oil's Reversal Sparks Hope for Soft Landing as Rate Cut Bets Rise
Unless Iran unexpectedly launches a full-scale assault on the Strait of Hormuz, it’s hard to imagine oil prices retesting — let alone surpassing — Monday’s high anytime soon. The fact that Iran's retaliation came with prior warnings strongly suggests the conflict may be de-escalating. This shift in tone could allow traders to refocus on the slowing US economy, the prospect of Federal Reserve (Fed) rate cuts, and a potential Wall Street rally driven by renewed hopes of a soft landing.
Fed fund futures are now implying a 67% chance of a September cut, up from around 57% by Friday’s close.
WTI Crude Oil Futures (CL) Technical Analysis
I outlined a bearish scenario for WTI crude oil on Friday — and while prices gapped higher to a fresh 19-month high on Monday, the rally quickly reversed. The aggressive selloff strongly suggests a significant swing high may now be in place.
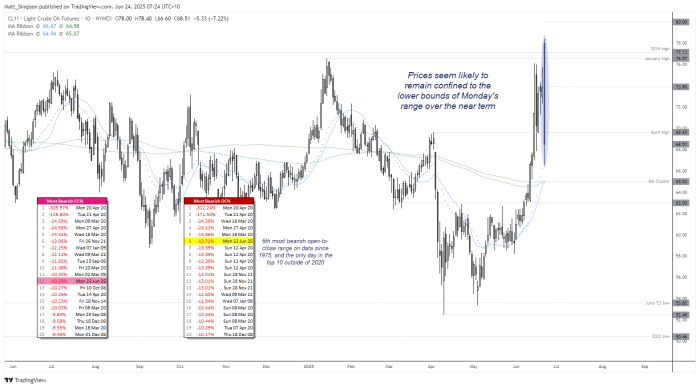
WTI crude oil’s intraday reversal was dramatic: Monday’s open-to-close decline of -13.7% ranks as the sixth-worst single-day drop since 1975. Notably, it is the only occurrence in the top 10 that did not take place during the 2020 COVID-19 shock. On a close-to-close basis, crude posted a -10.3% decline — its 12th-worst day in the historical dataset.
WTI Crude Oil Futures (CL): Daily Chart
The daily chart of WTI crude oil shows prices are currently holding above the 20-day EMA at $66.47. After Monday’s sharp selloff, crude recovered by roughly 3% from the session low, but the volatile nature of the candle suggests price action may remain confined to the lower bounds of its recent range. Key resistance levels to watch include the April high at $69.37 and the psychological 70.00 handle, both of which could cap near-term upside. Also note the support cluster ~65 which includes the 200-day EMA, 200-day SMA (simply moving average) and 20-day SMA.
WTI crude oil daily chart highlights Monday’s extreme reversal, marking the 6th most bearish open-to-close drop since 1975. Prices recovered slightly from lows and are now hovering above key support near $66, with resistance around $69–$70 likely to cap near-term upside.
WTI Crude Oil Futures (CL)L 1-Hour Chart
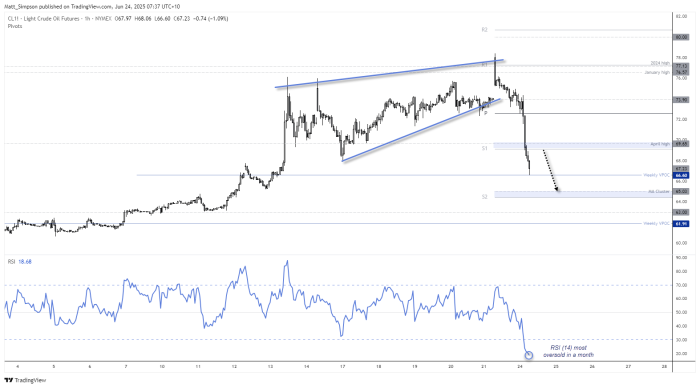
The 1-hour WTI crude oil chart shows the RSI (14) has dropped to its most oversold level since May 25. While there’s no clear bullish divergence yet, such an extreme reading after a sharp decline in oil prices could prompt some profit-taking and a minor rebound in the short term.
Interestingly, yesterday’s low found support precisely at a weekly volume point of control (VPOC), reinforcing its technical significance. Looking ahead, the weekly S1 pivot at $69.13 aligns just beneath the April high and the key $70 psychological level, making it a potential near-term target for WTI bulls, or a zone for crude oil bears to consider reloading. Also worth noting, the weekly S2 pivot is located near the $65 support cluster, where several moving averages converge — further strengthening its technical relevance.
The 1-hour WTI crude oil chart shows RSI (14) at its most oversold level since May 25, hinting at possible short-term profit-taking after a sharp drop. Price found support at the weekly VPOC, reinforcing its importance. Resistance is seen near $69.13 (weekly S1 pivot) and the $70 psychological level, while key support rests near $65, where multiple moving averages and the weekly S2 pivot converge.
Wall Street Futures Technical Analysis: S&P 500, Nasdaq 100, Dow Jones
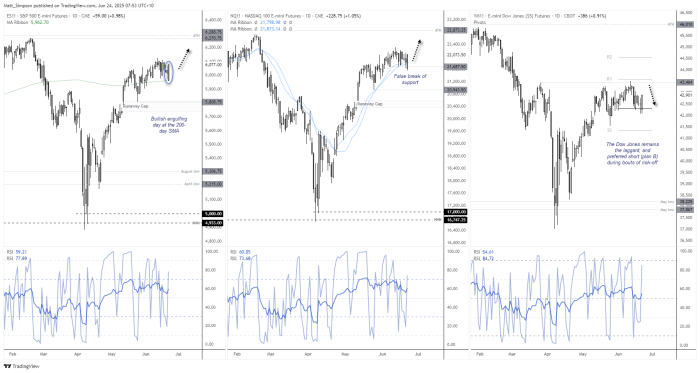
Bullish engulfing candles formed on Monday for all three Wall Street futures contracts, with the Nasdaq leading the way at 1.05% and the S&P 500 close by at 0.98%. This suggest a swing low could be in place for Wall Street indices, though my preference for longs would be the S&P 500 and Nasdaq 100 (in that order), with the Dow Jones reserved for shorts.
Bullish engulfing candles formed on Monday across the S&P 500, Nasdaq 100, and Dow Jones futures, suggesting a potential swing low for Wall Street indices. The S&P 500 rebounded off its 200-day SMA near 5962.7 and closed above 6,000, while the Nasdaq 100 reversed from below 21,687, hinting at bullish momentum toward record highs. Meanwhile, the Dow Jones lagged and remains a candidate for shorts unless it breaks above the ~43,500 resistance cluster.
S&P 500 Futures (ES) Technical Analysis
Monday’s bullish engulfing candle on the S&P 500 index perfectly respected the 200-day simple moving average (SMA) at 5962.7, which acted as a springboard for a decisive close back above the key 6,000 level. Notably, the daily RSI (2) is not yet overbought despite the strong session, while the RSI (14) is turning higher above 50 — a sign of improving bullish momentum. With sentiment stabilising, S&P 500 bulls may look to buy dips within Monday’s range in anticipation of a potential breakout to fresh all-time highs.
Nasdaq 100 Futures (NQ) Technical Analysis
While the Nasdaq 100 index doesn’t have the benefit of the 200-day SMA as support like the S&P 500, it is trading much closer to its all-time high in relative terms. Monday’s bullish engulfing candle also marked a false break below the 21,687 support level, signalling strong dip-buying interest around that area. With bullish momentum building, Nasdaq bulls may look to buy into minor pullbacks within Monday’s range, anticipating a breakout to new record highs in the near term.
Dow Jones Futures (YM) Technical Analysis
The Dow Jones remains the laggard of the three Wall Street indices. And that keeps in in reserve for bouts of risk-off, technically making it a Wall Street hedge. SO while the Dow Jones also has a bullish engulfing candle and shows the potential to have another crack at its cycle high, I am more interested in exploring short opportunities if the Dow failed to break above the resistance cluster ~43,500.
Economic Events in Focus (AEST / GMT+10)
13:00 NZD Credit Card Spending (YoY) (May) (NZD/USD, NZX 50)
15:00 JPY BoJ Core CPI (YoY) (USD/JPY, EUR/JPY, AUD/JPY Nikkei 225)
18:00 EUR German Ifo Business Climate, Expectations, Current Assessment (Jun) (EUR/USD, EUR/JPY, EUR/GBP, DAX)
20:00 GBP CBI Industrial Trends Orders (Jun) (GBP/USD, FTSE 100)
21:15 EUR ECB's De Guindos Speaks (EUR/USD, DAX)
22:30 USD Current Account (Q1) (USD, S&P 500, Nasdaq 100, Dow Jones, Gold, Crude Oil)
22:30 CAD CPI, Core/Common/Trimmed CPI, Manufacturing Sales (May) (USD/CAD, TSX)
23:00 USD House Price Index & S&P/CS HPI (Apr) (USD, S&P 500, Dow Jones)
23:00 EUR ECB President Lagarde Speaks (EUR/USD, DAX)
23:35 GBP MPC Member Ramsden Speaks (GBP/USD, FTSE 100)
23:55 EUR ECB's Lane Speaks (EUR/USD, DAX)
00:00 GBP BoE Gov Bailey Speaks (GBP/USD, GBP/JPY, GBP/CHF, FTSE 100)
00:00 USD CB Consumer Confidence, Fed Chair Powell Testifies, Richmond Fed Indices (Jun) (USD, S&P 500, Nasdaq 100, Dow Jones, Gold, Crude Oil)
01:30 GBP BoE Breeden Speaks (GBP/USD, FTSE 100)
01:40 GBP BoE MPC Member Pill Speaks (GBP/USD, GBP/JPY, GBP/CHF, FTSE 100)
02:00 USD 2-Year Note Auction (USD, Treasury Market)
02:30 USD FOMC Member Williams Speaks (USD, S&P 500, Nasdaq 100)
03:00 USD M2 Money Supply (MoM) (USD, S&P 500, Gold)




Open an account in minutes
Experience award-winning platforms with fast and secure execution, and enjoy tight spreads from 0.5 pts on FX and 0.3 pts on indices.
Economic calendar
Web Trader platform
Our sophisticated web-based platform is packed with features.
Related articles

Crude Oil Forecast: Weekend Iran Strike Fears Lift Oil Toward War Highs
Brent crude oil is accelerating above $110 as traders price in the risk of a US-Israeli strike on Iran over the weekend. How much more of a geopolitical premium can oil build in before the close?


Nasdaq 100 Forecast: NDX Falls as the tech rout continues and oil prices soar
U.S. stocks are pointing to a modestly lower open after a sharp AI sell-off yesterday, as telecom stocks slide. Brent rises towards $115 adding to inflation pressures ahead of the FOMC rate decision.


Brent WTI Spread Hits 11-Year Wall and RSI Hits 2011 Highs
The Brent WTI spread is testing resistance that has held for about 11 years, with monthly RSI at overbought levels last seen in 2011.

This report is intended for general circulation only. It should not be construed as a recommendation, or an offer (or solicitation of an offer) to buy or sell any financial products. The information provided does not take into account your specific investment objectives, financial situation or particular needs. Before you act on any recommendation that may be contained in this report, independent advice ought to be sought from a financial adviser regarding the suitability of the investment product, taking into account your specific investment objectives, financial situation or particular needs.
StoneX Financial Pte. Ltd., may distribute reports produced by its respective foreign entities or affiliates within the StoneX group of companies or third parties pursuant to an arrangement under Regulation 32C of the Financial Advisers Regulations. Where the report is distributed to a person in Singapore who is not an accredited investor, expert investor or an institutional investor (as defined in the Securities Futures Act), StoneX Financial Pte. Ltd. accepts legal responsibility to such persons for the contents of the report only to the extent required by law. Singapore recipients should contact StoneX Financial Pte. Ltd. at 6826 9988 for matters arising from, or in connection with the report.
In the case of all other recipients of this report, to the extent permitted by applicable laws and regulations neither StoneX Financial Pte. Ltd. nor its associated companies will be responsible or liable for any loss or damage incurred arising out of, or in connection with, any use of the information contained in this report and all such liability is hereby expressly disclaimed. No representation or warranty is made, express or implied, that the content of this report is complete or accurate.
StoneX Financial Pte. Ltd. is not under any obligation to update this report.
Trading CFDs carries a high level of risk that may not be suitable for some investors. Consider your investment objectives, level of experience, financial resources, risk appetite and other relevant circumstances carefully. The possibility exists that you could lose some or all of your investments, including your initial deposits. If in doubt, please seek independent expert advice. Visit www.forex.com/en-sg/terms-and-policies for the complete Risk Disclosure Statement.