



AUD/USD, Nasdaq Soar as Trump Blinks First, Sparking Epic Market U-Turn
President Trump made an unexpected reversal on Wednesday by temporarily lowering tariffs on many of the countries he had just imposed them on. Risk surged, seeing the Nasdaq achieve its fourth best day in history and AUD/USD marked its best day in 15 years.
Share this:
View related analysis:
- NZD/USD, AUD/USD Catch Sympathy Bid as RBNZ Play Safe with 25bp Cut
- AUD/USD Analysis: Eyes on China and the yuan Amid Trump’s 104% Tariff
- AUD/JPY, Wall Street: Tentative Signs of Stability Amid Tariff Turbulence
- Traders Placed Bets Against VIX and Swiss Franc Ahead of Tariffs: COT Report
President Trump made an unexpected reversal on Wednesday by temporarily lowering tariffs on many of the countries he had just imposed them on. Most have now been reduced to the baseline 10% for the next 90 days—mirroring the suggestion made earlier this week by billionaire investor Bill Ackman.
China, however, wasn’t let off the hook. Trump instead hiked their tariffs to 125%, seemingly punishing them for not crawling to the negotiation table and begging for a deal.
I’ll admit, I didn’t expect Trump to blink so quickly, especially with world leaders supposedly queuing up to strike a deal with the man himself. But it’s clear he had been under significant pressure - from business leaders, and from mounting negative headlines about the economy, as well as turmoil in the stock and bond markets.
Nasdaq 100 futures led Wall Street’s bullish stampede
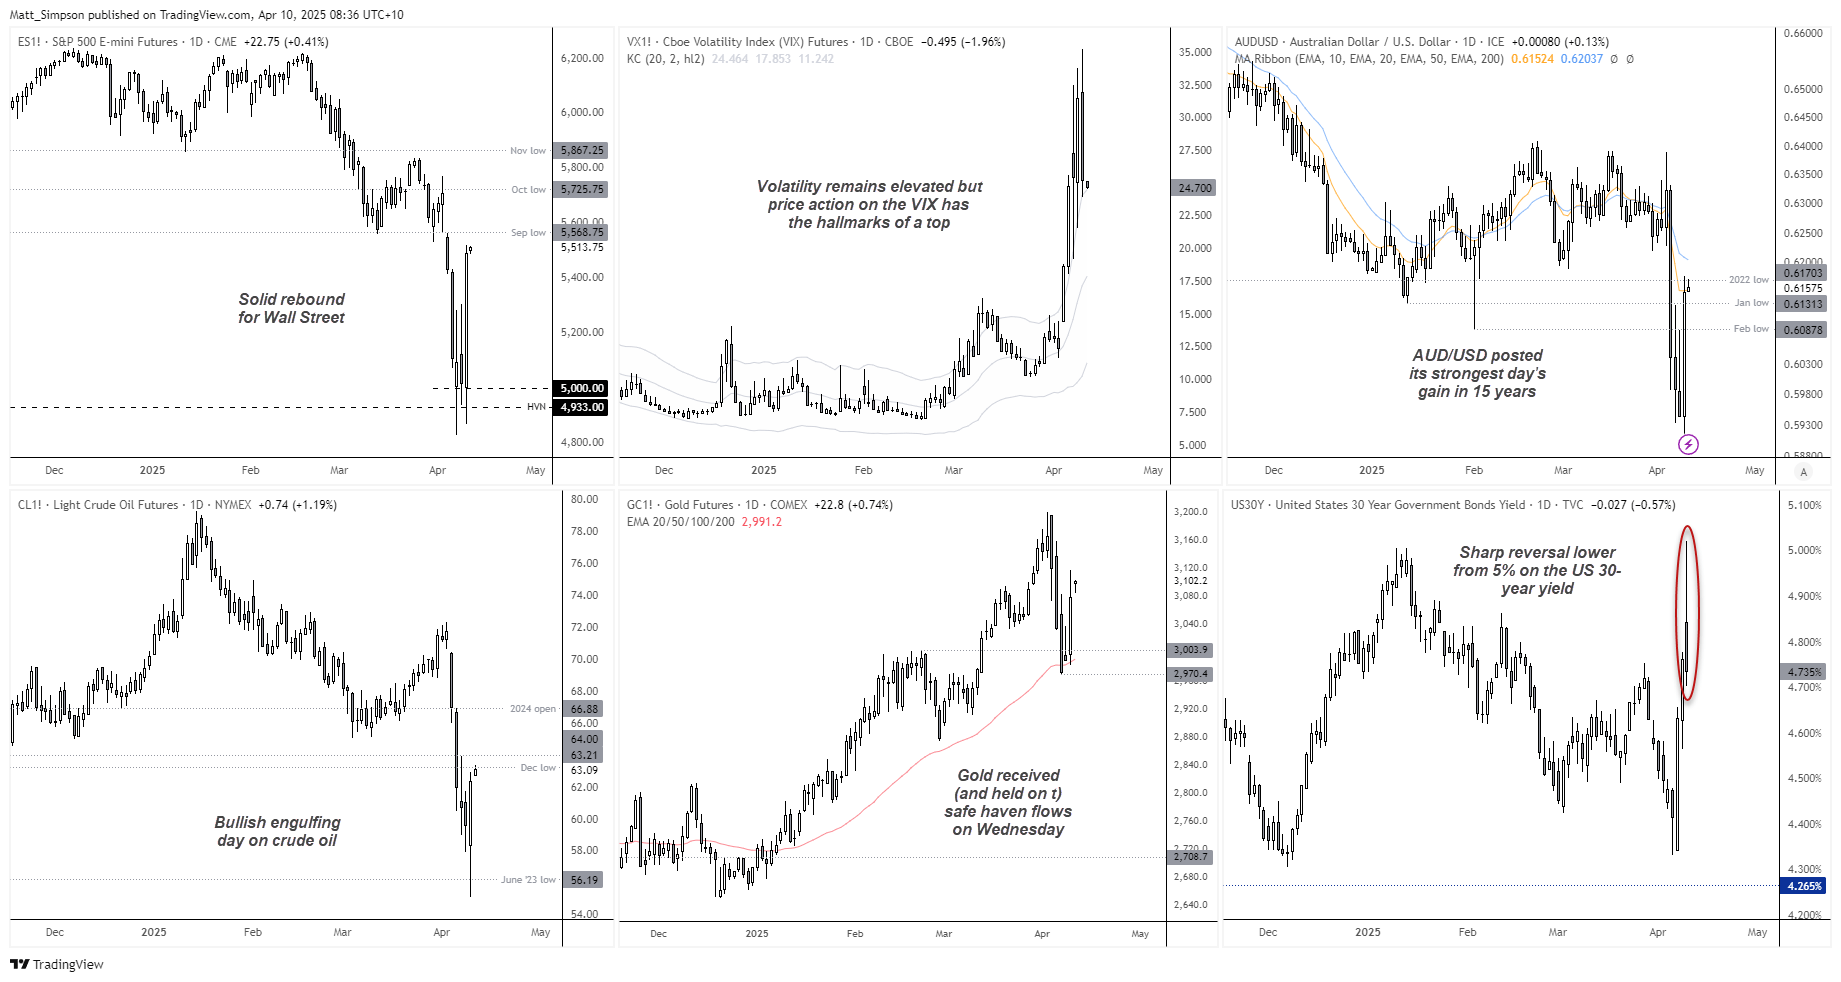
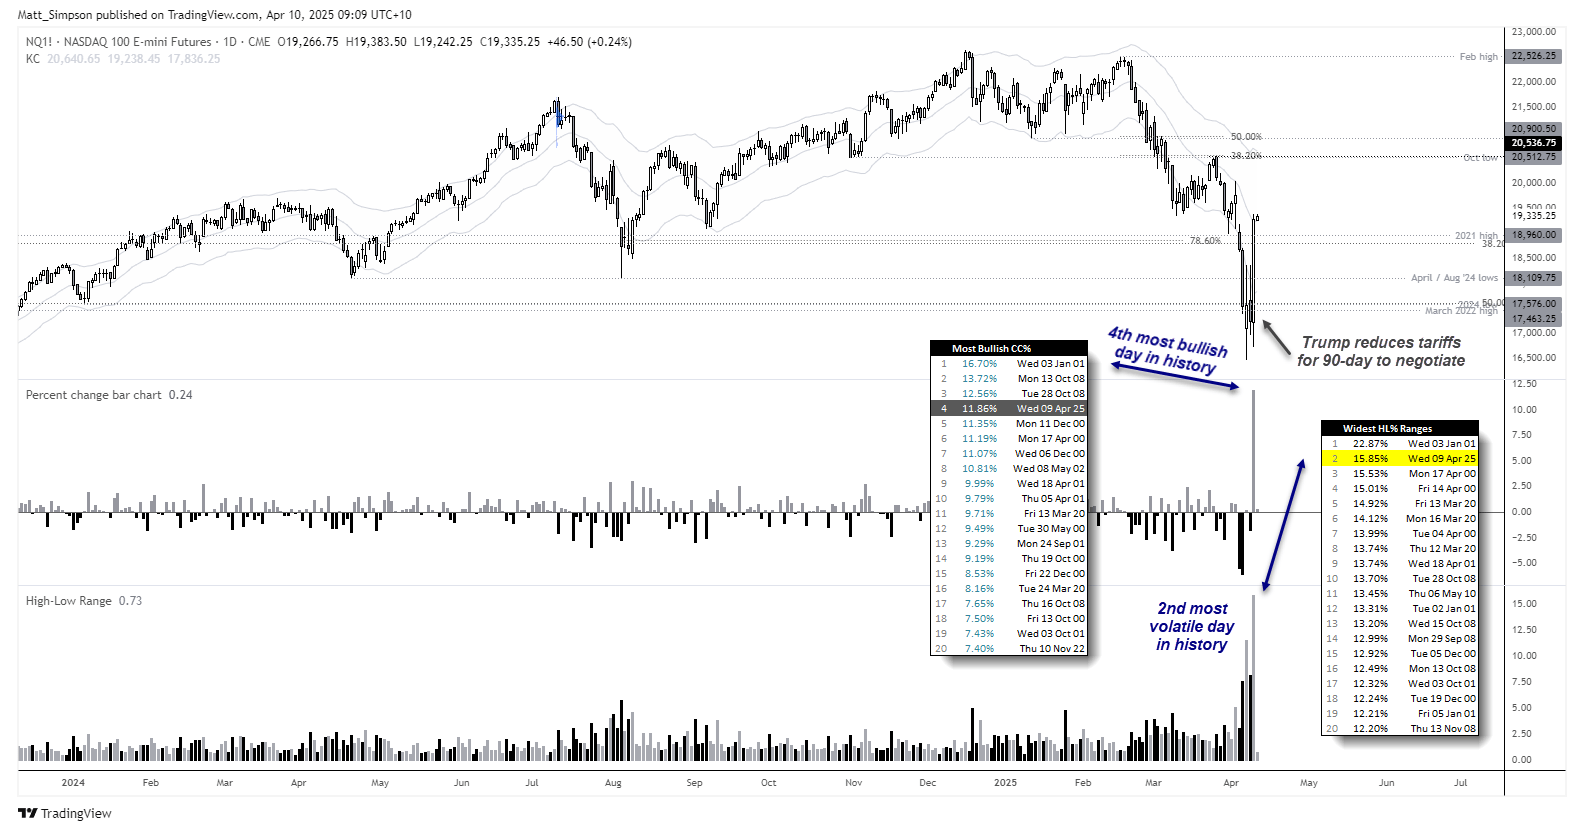
To say risk assets took it well would be an understatement. Wall Street notched one of its best days in history, with Nasdaq 100 futures surging an incredible 11.8% (fourth best day on record) - most of which came after lunchtime. It also marked the second most volatile day for the Nasdaq on record, with a daily high to low range of 15.9%. S&P 500 futures soared 9.4%, and the Dow Jones rose 7.9%.
- The volatility index (VIX) was down -6.24 points to 25.2, its fastest single-day decline since August 2024. Volatility remains elevated of course, but this is how tops begin.
- The US dollar index closed flat, though a bullish pinbar formed which also could be part of a higher low
- WTI crude oil formed rallied 4.7% to mark its best day of the year, forming bullish engulfing day, following a false break of the June 2023 low
- Gold held onto its safe-haven gains achieved earlier on Wednesday, after the 30-year bond surged to 5% in the Asian session (note the solid rebound from the 50-day EMA)
- Bond traders returned to support prices, which saw the 30-year yield perform a sharp reversal lower from the 5% level set in Asia
- Commodity FX led the way for FX majors, with AUD/USD, NZD/USD and CAD being the strongest majors while the Swiss franc (CHF) and Japanese yen (JPY) were the weakest amid a clear risk-on session
- Interestingly, China’s futures markets were also a touch higher overnight despite the rise of Trump’s tariffs
AUD/USD technical analysis
The Australian dollar rebounded alongside risk assets—a welcome surprise, given it had been teetering on the edge of breaking below 59 cents on Wednesday. Its 3.4% jump marked the strongest one-day rally in 15 years, and the 14th best day on record. Prices have now climbed back above the January and February lows, although resistance has been found around the 2022 low and the 10-day moving average.
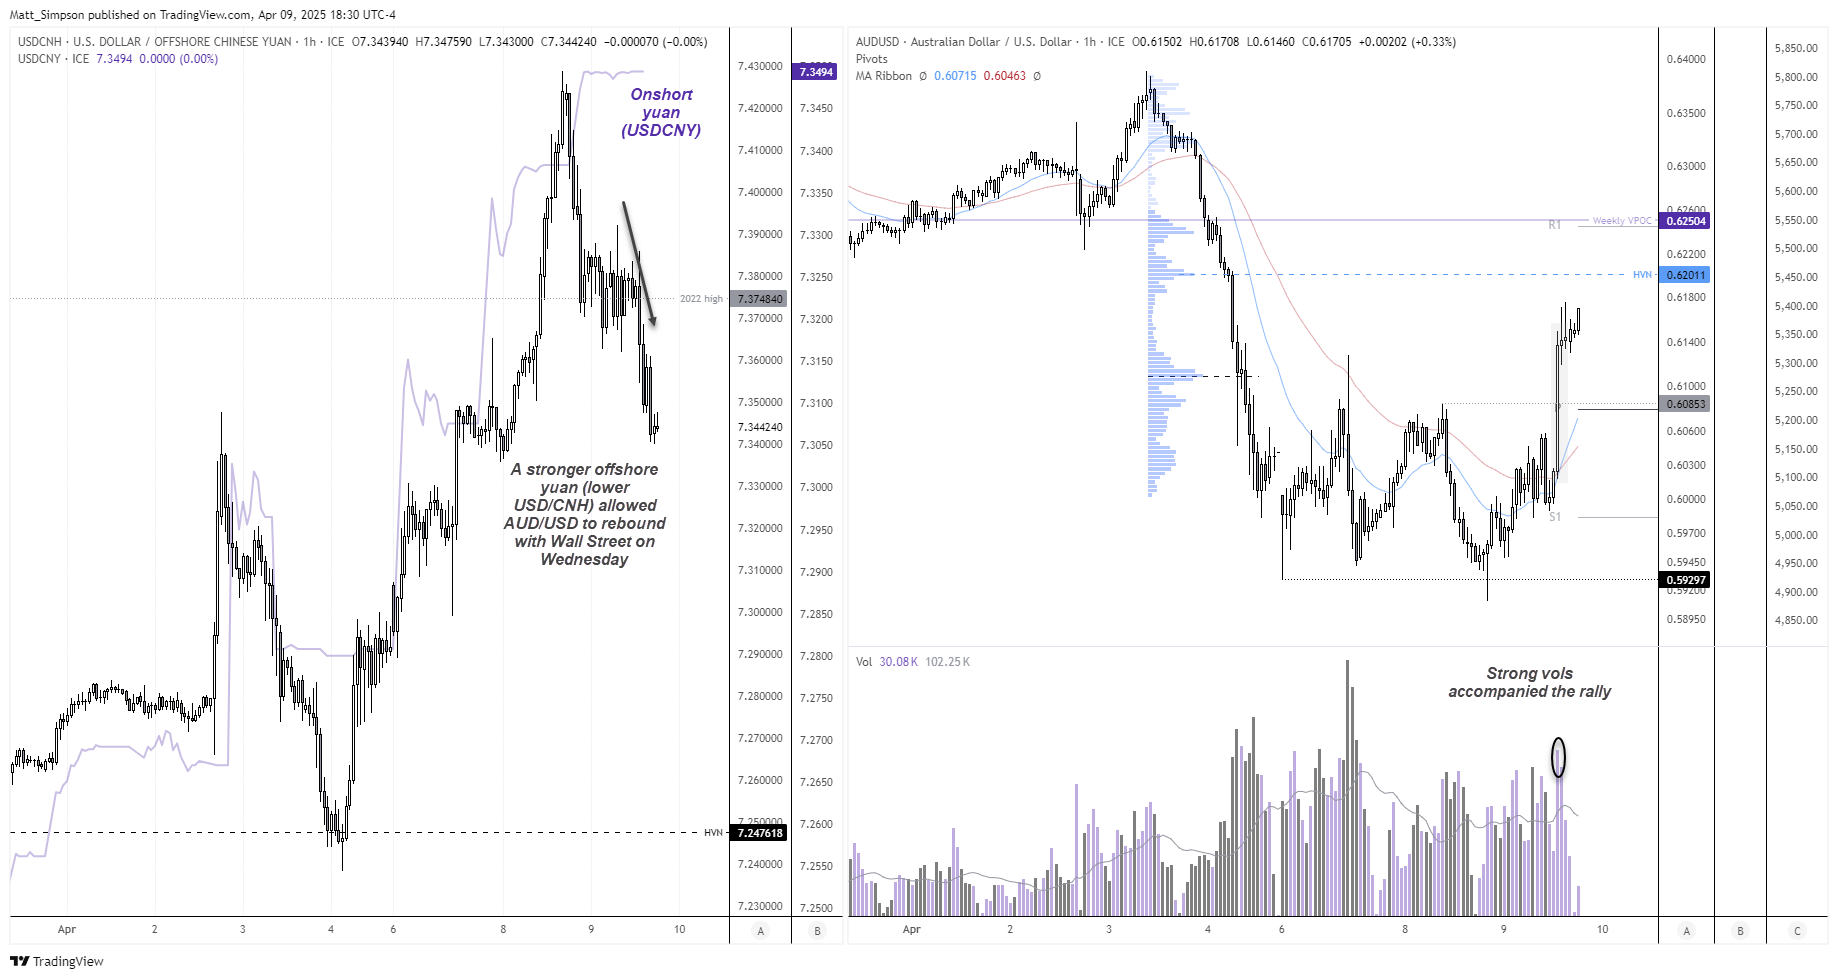
AUD/USD appeared to gain breathing room as traders bet that Beijing would refrain from aggressively weakening its currency. The offshore yuan rallied, with USD/CNH erasing all of Tuesday’s gains to finish the session effectively flat. That move gave AUD/USD the green light to rally alongside broader risk sentiment when Trump announced a rollback in tariffs.
The 1-hour chart on AUD/USD shows strong volumes accompanied the rebound from ~60c to 0.6140. A couple of bearish pinbars and small-ranged candles alongside lower volumes suggest near-term exhaustion to the move, but if AUD/USD provides any dips then bulls may seek to have another crack at 62c near a high-volume node (HVN).
I doubt we’ll see Wednesday’s level of volatility repeated today, but if Wall Street futures can hold on to gains and USD/CNH avoid a rally (keep an eye on China’s fix at 11:15) then a move to 0.6200 and 0.6250 could be on the cards.
-- Written by Matt Simpson
Follow Matt on Twitter @cLeverEdge
How to trade with City Index
You can trade with City Index by following these four easy steps:
- Open an account, or log in if you’re already a customer
• Open an account in the UK
• Open an account in Australia
• Open an account in Singapore
- Search for the market you want to trade in our award-winning platform
- Choose your position and size, and your stop and limit levels
- Place the trade



Open an account in minutes
Experience award-winning platforms with fast and secure execution, and enjoy tight spreads from 0.5 pts on FX and 0.3 pts on indices.
Economic calendar
Web Trader platform
Our sophisticated web-based platform is packed with features.
Related articles
Australian Dollar Outlook: AUD/USD Screams Sentiment Extreme Into Fed, CPI
AUD/USD rebounds despite record bearish futures positioning, with Australian Q3 CPI and the Fed meeting threatening to trigger another short squeeze.

EUR/USD weekly outlook: FOMC and ECB to set the tone
The current backdrop is modestly bearish. On Friday, the EUR/USD closed modestly lower, down for the third consecutive day. The pair also posted a weekly decline after staging a modest recovery attempt in the previous week. Out of the past 8 weeks, the EUR/USD has fallen on 6 occasions. There is not much supporting factors for the single currency right now. So, the upside remains capped.


Silver forecast: metals liquidation drags XAG/USD into $50-55 support
Silver has broken its July low and slipped into a long-term support zone as the selling in precious metals deepens. The chart shows where the metal could bottom, and next week's Fed decision may decide whether it does.
This report is intended for general circulation only. It should not be construed as a recommendation, or an offer (or solicitation of an offer) to buy or sell any financial products. The information provided does not take into account your specific investment objectives, financial situation or particular needs. Before you act on any recommendation that may be contained in this report, independent advice ought to be sought from a financial adviser regarding the suitability of the investment product, taking into account your specific investment objectives, financial situation or particular needs.
StoneX Financial Pte. Ltd., may distribute reports produced by its respective foreign entities or affiliates within the StoneX group of companies or third parties pursuant to an arrangement under Regulation 32C of the Financial Advisers Regulations. Where the report is distributed to a person in Singapore who is not an accredited investor, expert investor or an institutional investor (as defined in the Securities Futures Act), StoneX Financial Pte. Ltd. accepts legal responsibility to such persons for the contents of the report only to the extent required by law. Singapore recipients should contact StoneX Financial Pte. Ltd. at 6826 9988 for matters arising from, or in connection with the report.
In the case of all other recipients of this report, to the extent permitted by applicable laws and regulations neither StoneX Financial Pte. Ltd. nor its associated companies will be responsible or liable for any loss or damage incurred arising out of, or in connection with, any use of the information contained in this report and all such liability is hereby expressly disclaimed. No representation or warranty is made, express or implied, that the content of this report is complete or accurate.
StoneX Financial Pte. Ltd. is not under any obligation to update this report.
Trading CFDs carries a high level of risk that may not be suitable for some investors. Consider your investment objectives, level of experience, financial resources, risk appetite and other relevant circumstances carefully. The possibility exists that you could lose some or all of your investments, including your initial deposits. If in doubt, please seek independent expert advice. Visit www.forex.com/en-sg/terms-and-policies for the complete Risk Disclosure Statement.