



AUD/USD Nears 72c as AU and US CPI, Jackson Hole Loom
AUD/USD is closing in on 72c as Australian and US inflation reports collide with Jackson Hole, setting the stage for a potentially volatile end to the week.
Share this:

AUD/USD enters a potentially pivotal stretch within striking distance of 72c, with Australian CPI, US inflation and Jackson Hole putting RBA and Fed policy expectations firmly in focus.
View related analysis:
View related analysis:
Australian CPI, US Inflation and Jackson Hole Put AUD/USD in Focus
While markets are really waiting for the Fed Chair to speak at Jackson Hole on Friday, they have two key inflation reports to chew. Australia’s July CPI report lands at a particularly important time for the RBA, after minutes from its August meeting revealed that several board members considered another rate hike before ultimately voting to hold at 4.35%.
Australian CPI Tests the RBA’s Hawkish Bias
Inflation has cooled from its recent peak to 3.8% and trimmed mean inflation undershooting expectations, yet at 3.6% it remained well above the RBA’s 1-3% target band. Today’s release therefore provides another test of whether inflation is genuinely losing momentum or simply pausing. A softer headline number is widely expected due partly to base effects, which makes the trimmed mean and underlying details arguably more important for markets. A stronger-than-expected reading could revive expectations of another RBA hike and support the Australian dollar, while further evidence of cooling inflation could push tightening expectations further out.
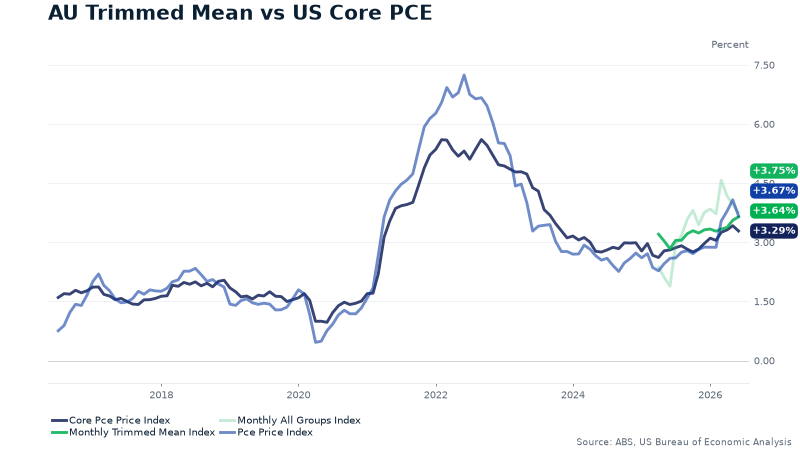
Source: ABS, BEA
US Core PCE Sets the Stage for Jackson Hole
US core PCE is equally important for Fed watchers, with the central bank maintaining a hawkish bias even though rates are expected to remain on hold at its next meeting. Today’s release could also shape Kevin Warsh’s messaging when he delivers his first Jackson Hole speech as Fed Chair on Friday, where markets will be looking for greater clarity on the Fed’s policy direction.
Core PCE is the Fed’s preferred inflation gauge and was running at 3.3% year on year in June, well above its 2% target. That leaves little room for another upside surprise after several Fed officials warned that persistent inflation could require further tightening. A hotter print would strengthen the case for another hike, potentially lifting US yields and the dollar, while a softer reading would ease some of those concerns and could reinforce the recent pressure on the greenback.
US Dollar Volatility Recedes Ahead of Jackson Hole and Inflation
The US dollar index was a touch lower on Tuesday to break its two-day retracement, forming a small shooting star reversal candle around the 99 handle. This pattern was mimicked by USD/CHF around its January high resistance, and USD/CAD, which met resistance around its 10-day EMA. Meanwhile, EUR/USD, GBP/USD and AUD/USD formed small bullish inside days beneath their cycle highs, though volatility was low overall.
This is a pattern I highlighted in Monday’s article, noting that volatility tended to recede heading into the Jackson Hole speech before erupting on the day. Perhaps that is why one-day implied volatility for AUD/USD is only moderately elevated at 127% of its 20-day average, despite incoming inflation reports of interest to both the RBA and Fed.
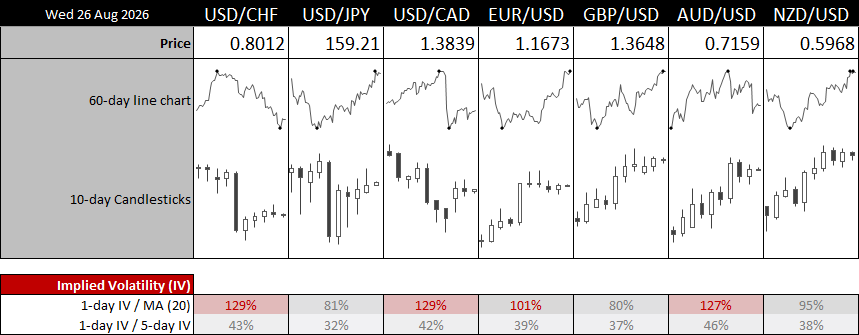
Source: LSEG
Jackson Hole Historically Delivers Volatility, Not Direction
Jackson Hole has historically been more reliable as a volatility event than a directional one. DXY volatility tends to ease in the days leading into the Fed Chair’s speech before rising sharply on the day itself, with the average daily range increasing to around 0.9%. Direction is far less consistent, with average DXY returns slightly negative on speech day but the median effectively flat.
AUD/USD shows a similar volatility pattern but a somewhat clearer directional bias. The pair has historically softened ahead of the speech before generating an average gain of around 0.3% on the day, while its average high-to-low range jumps to roughly 1.3%. As highlighted in my Jackson Hole FX returns and volatility preview, that suggests the event has been more dependable for delivering a larger trading range than predicting direction — particularly with AUD/USD already sitting close to key resistance
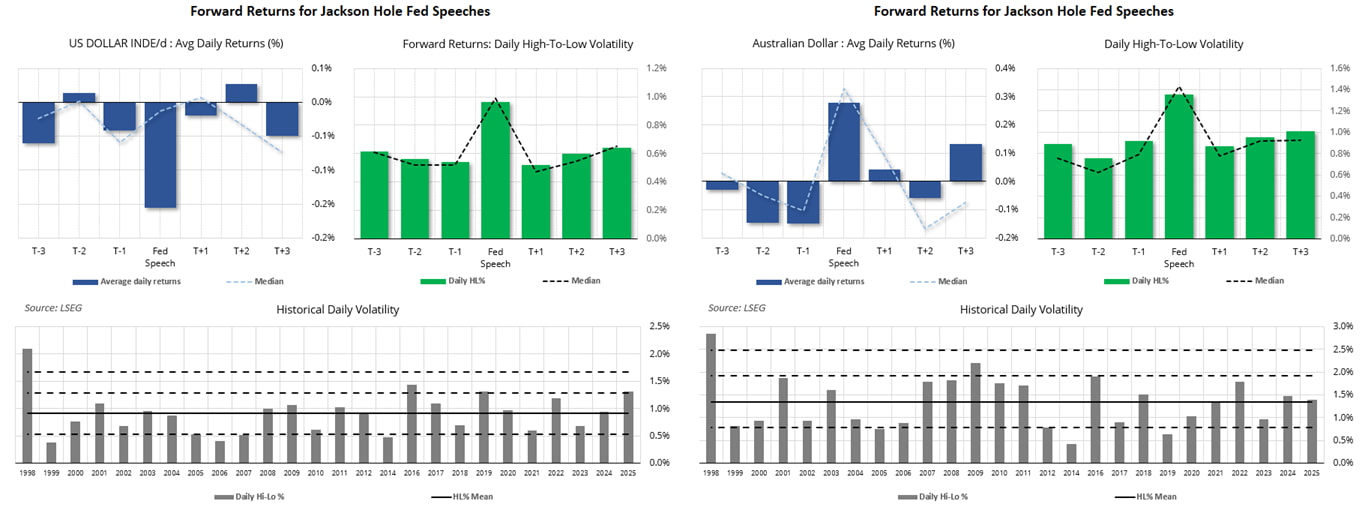
Source: LSEG
AUD/USD Technical Analysis: Australian Dollar vs US Dollar
Depending on which feed you follow, the Aussie has risen for eight consecutive weeks (according to Reuters) or five (via ICE). In either case, the rally has been impressive, and it is also accelerating — given last week’s rise was its most bullish in 18 weeks. That said, the broader trend in weekly volatility remains lower, while resistance looms around 72c and the May high — the latter of which seems likely to provide a decent level of resistance initially, if tested.
The daily chart shows AUD/USD resting on the monthly R2 pivot with a small bullish candle, as bulls ponder another crack at 72c while they await Australia’s inflation report. And should it come in hot, a move to 72c seems feasible. That said, if inflation were to soften even slightly and be followed by a slightly firmer US PCE report, then a break of Wednesday’s low would also clear the monthly R2 pivot and potentially see AUD/USD retrace towards its 10-day EMA (0.7115). Note that the 1-week implied volatility band suggests a 0.9% move in either direction with a 68% probability.
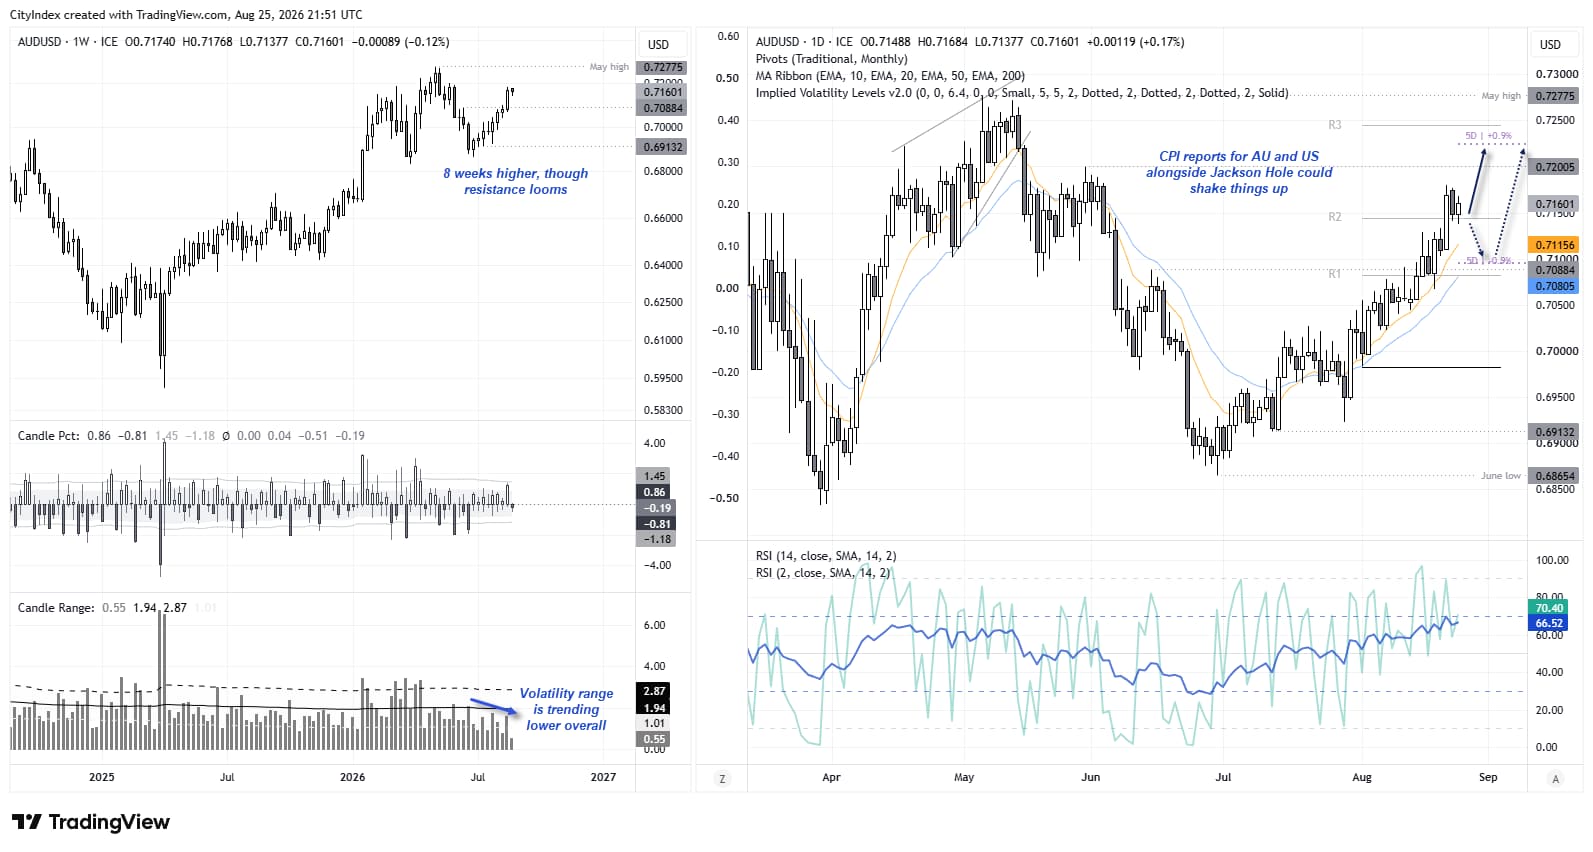
Source: ICE, TradingView
Related tags:


Open an account in minutes
Experience award-winning platforms with fast and secure execution, and enjoy tight spreads from 0.5 pts on FX and 0.3 pts on indices.
Economic calendar
Web Trader platform
Our sophisticated web-based platform is packed with features.
Related articles
USD/JPY weekly outlook: Quarter turn scrambles rates regime
USD/JPY’s tight relationship with front-end US rates broke down sharply last week, but quarter-turn flows and positioning suggest the disconnect may prove temporary.

USD/CAD forecast: rally could accelerate above June highs at 1.4250
USD/CAD recovered quickly after weaker US jobs data, keeping the bullish trend in focus. A move above the June highs could accelerate the rally as inflation keeps the Fed under pressure.


USD Sets Fresh Yearly High as EUR/USD Drops Dramatically, USD/JPY Stable
Well, it was a week of USD strength that wasn’t entirely pushed by USD/JPY, as a strong sell-off in EUR/USD has pushed the major pair to its most oversold state in a decade.

This report is intended for general circulation only. It should not be construed as a recommendation, or an offer (or solicitation of an offer) to buy or sell any financial products. The information provided does not take into account your specific investment objectives, financial situation or particular needs. Before you act on any recommendation that may be contained in this report, independent advice ought to be sought from a financial adviser regarding the suitability of the investment product, taking into account your specific investment objectives, financial situation or particular needs.
StoneX Financial Pte. Ltd., may distribute reports produced by its respective foreign entities or affiliates within the StoneX group of companies or third parties pursuant to an arrangement under Regulation 32C of the Financial Advisers Regulations. Where the report is distributed to a person in Singapore who is not an accredited investor, expert investor or an institutional investor (as defined in the Securities Futures Act), StoneX Financial Pte. Ltd. accepts legal responsibility to such persons for the contents of the report only to the extent required by law. Singapore recipients should contact StoneX Financial Pte. Ltd. at 6826 9988 for matters arising from, or in connection with the report.
In the case of all other recipients of this report, to the extent permitted by applicable laws and regulations neither StoneX Financial Pte. Ltd. nor its associated companies will be responsible or liable for any loss or damage incurred arising out of, or in connection with, any use of the information contained in this report and all such liability is hereby expressly disclaimed. No representation or warranty is made, express or implied, that the content of this report is complete or accurate.
StoneX Financial Pte. Ltd. is not under any obligation to update this report.
Trading CFDs carries a high level of risk that may not be suitable for some investors. Consider your investment objectives, level of experience, financial resources, risk appetite and other relevant circumstances carefully. The possibility exists that you could lose some or all of your investments, including your initial deposits. If in doubt, please seek independent expert advice. Visit www.forex.com/en-sg/terms-and-policies for the complete Risk Disclosure Statement.