




AUD/USD Weekly outlook: RBA Poised To Cut by 25bp
AUD/USD weakens as traders await the RBA decision. A 25bp cut is expected, but tariff concerns and US dollar flows continue to influence sentiment.
Share this:

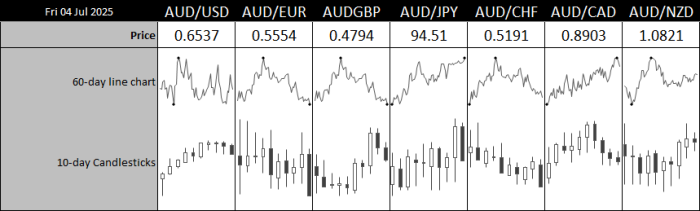
AUD/USD is under pressure for a third straight day as renewed US tariff threats weigh on risk sentiment. With a quiet US calendar due to Independence Day and June CPI not scheduled until next week, focus shifts to the RBA. A 25bp cut to 3.6% is widely expected, but with markets pricing in further easing, the tone of the statement could have a bigger impact on AUD/USD direction in the days ahead.
View related analysis:
View related analysis:
Australian Dollar Slips Ahead of RBA Decision Amid US Tariff and Holiday Lull
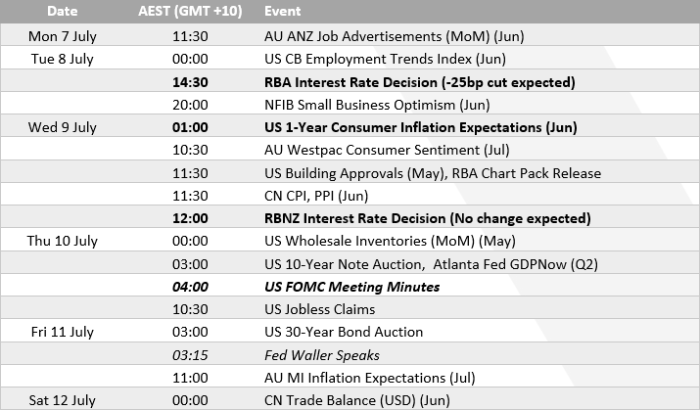
US Independence Day celebrations usually extend through to the Monday for much of the US, meaning many take a four-day weekend. That could make for a quiet start to the week for traders. It’s also not a big week for US economic data, with June CPI figures not due until next Tuesday.
So, while the FOMC minutes and US inflation expectations are worth monitoring, I do not anticipate either to be game-changers where Fed policy is concerned.
The Australian dollar is trading lower for a third day on renewed tariff concerns. US Treasury Secretary Scott Bessent warned on Sunday that tariffs will return unless trade deals are made by August 1. While Australia’s 10% tariff is not ideal, it is also not likely to hinder the economy too much. But it serves as a reminder that AUD/USD can be directed by Trump’s trade war.
RBA Expected to Cut Rates as Market Bets on Further Easing
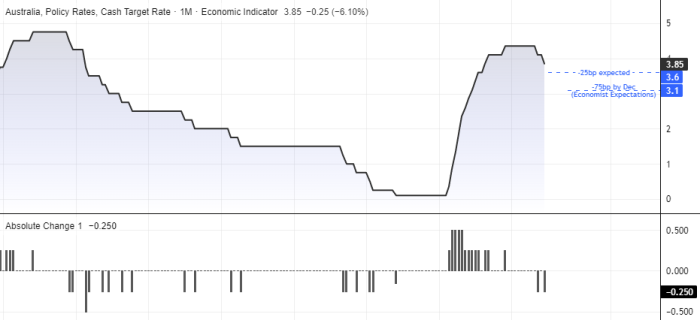
And that brings us nicely to tomorrow’s RBA meeting. A 25bp cut to 3.6% seems highly likely, given Australia’s inflation has slowed to a 3.5-year low and Q1 growth was sluggish at 0.2%. There’s a decent chance the RBA will strike a cautious tone—given their well-known propensity to remain “cautious about the outlook”. But with economists favouring an end-of-year cash rate of 3.1% (allowing for a further two cuts) and market pricing suggesting around four cuts, the RBA are likely aware that expectations for further easing are intensifying. I’m just not convinced they’ll unveil a roadmap for three or four cuts at tomorrow’s meeting, though they may strike a slightly dovish tone to keep such expectations alive.
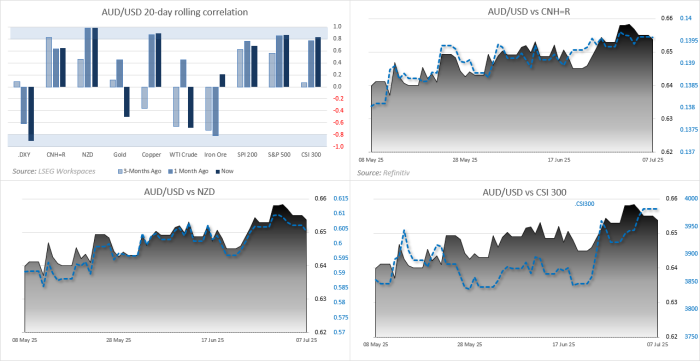
AUD/USD Correlations
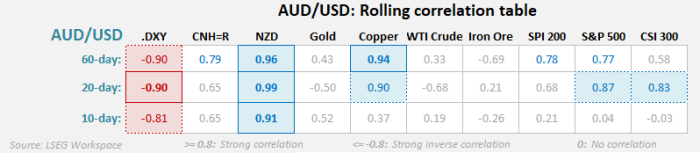
Australian dollar correlations largely stem from the anti-US dollar trade. The inverse relationship between AUD/USD and the US Dollar Index (DXY) remains strong across 10, 20 and 60-day lookbacks. And the positive correlation with NZD/USD remains very strong across all timeframes (and all above 0.9).
Though it is interesting to see the Australian dollar’s 10-day correlation break down on copper and China’s CSI 300 compared to last week, and commodities in general with gold and WTI crude oil seemingly doing their own thing.
AUD/USD Technical Analysis
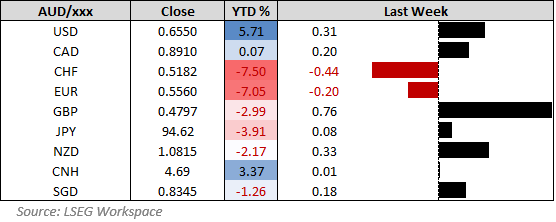
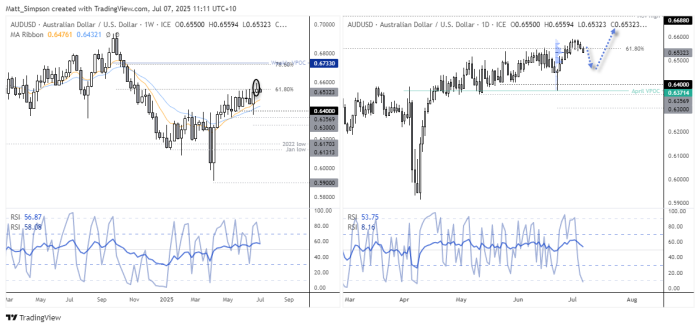
While the Australian dollar reached an 8-month high last week, there are signs that it may not be ready to fully extend its rally. A shooting star candle formed on the weekly chart, with the high-to-low range shrinking to half that of the prior week. AUD/USD also closed on the 61.8% Fibonacci retracement level, once again highlighting hesitation around the 0.6550 area. A bearish divergence continues to build on the weekly RSI (2), adding further caution for bulls.
On the daily chart, momentum appears to be turning lower. Bears may look to fade rallies within the prior two-day range, assuming AUD/USD is not yet ready to break above last week’s high. A dovish surprise from the RBA could support a move below 0.6500.
View the full economic calendar
View the full economic calendar
-- Written by Matt Simpson
Follow Matt on Twitter @cLeverEdge
How to trade with City Index
You can trade with City Index by following these four easy steps:
- Open an account, or log in if you’re already a customer
• Open an account in the UK
• Open an account in Australia
• Open an account in Singapore
- Search for the market you want to trade in our award-winning platform
- Choose your position and size, and your stop and limit levels
- Place the trade




Open an account in minutes
Experience award-winning platforms with fast and secure execution, and enjoy tight spreads from 0.5 pts on FX and 0.3 pts on indices.
Economic calendar
Web Trader platform
Our sophisticated web-based platform is packed with features.
Related articles

Australian Dollar Forecast: AUD/USD Support Reversal Sparks Monthly Range Breakout 10 23 2026
A sharp reversal off key support has fueled the AUD/USD recovery, with resistance now in focus ahead of next week’s Fed decision and Australian CPI.

AUD/USD Bears Denied a Big, Bearish Breakout via Hawkish RBA, Weak USD
AUD/USD defies a potential head-and-shoulders breakdown as RBA rate hike bets surge and a weaker US dollar fuels an Australian dollar rally.

AUD/USD, NZD/USD Outlook: Corrective Recoveries Face Growing Headwinds
A weaker US dollar, falling Treasury yields and renewed demand for cyclical assets have supported the Aussie and Kiwi. But with some of those moves reversing on Monday, both currencies face an early test of whether their recent strength can continue.

This report is intended for general circulation only. It should not be construed as a recommendation, or an offer (or solicitation of an offer) to buy or sell any financial products. The information provided does not take into account your specific investment objectives, financial situation or particular needs. Before you act on any recommendation that may be contained in this report, independent advice ought to be sought from a financial adviser regarding the suitability of the investment product, taking into account your specific investment objectives, financial situation or particular needs.
StoneX Financial Pte. Ltd., may distribute reports produced by its respective foreign entities or affiliates within the StoneX group of companies or third parties pursuant to an arrangement under Regulation 32C of the Financial Advisers Regulations. Where the report is distributed to a person in Singapore who is not an accredited investor, expert investor or an institutional investor (as defined in the Securities Futures Act), StoneX Financial Pte. Ltd. accepts legal responsibility to such persons for the contents of the report only to the extent required by law. Singapore recipients should contact StoneX Financial Pte. Ltd. at 6826 9988 for matters arising from, or in connection with the report.
In the case of all other recipients of this report, to the extent permitted by applicable laws and regulations neither StoneX Financial Pte. Ltd. nor its associated companies will be responsible or liable for any loss or damage incurred arising out of, or in connection with, any use of the information contained in this report and all such liability is hereby expressly disclaimed. No representation or warranty is made, express or implied, that the content of this report is complete or accurate.
StoneX Financial Pte. Ltd. is not under any obligation to update this report.
Trading CFDs carries a high level of risk that may not be suitable for some investors. Consider your investment objectives, level of experience, financial resources, risk appetite and other relevant circumstances carefully. The possibility exists that you could lose some or all of your investments, including your initial deposits. If in doubt, please seek independent expert advice. Visit www.forex.com/en-sg/terms-and-policies for the complete Risk Disclosure Statement.