






AUD/USD Weekly Outlook: RBA Set for Cautious Cut as US CPI Looms
AUD/USD holds near recent highs ahead of an expected RBA cut, with US CPI the key risk event that could shift momentum.
Share this:

- RBA expected to cut by 25bp tomorrow
- US CPI is the main US economic data point, though retail sales and consumer sentiment warrant a look
- Seeking evidence of a swing high on the AUD/USD daily chart for a retest of the 200-day EMA
The Australian dollar is steady ahead of Tuesday’s Reserve Bank of Australia (RBA) meeting, where markets widely expect a 25bp cut to 3.6%. While the move has been well-flagged, traders will be watching the tone of the Statement on Monetary Policy for clues on whether another cut could follow later this year. With US CPI due just hours after the RBA decision, volatility for AUD/USD is expected – of which I’m seeking evidence of a swing high on the daily chart.
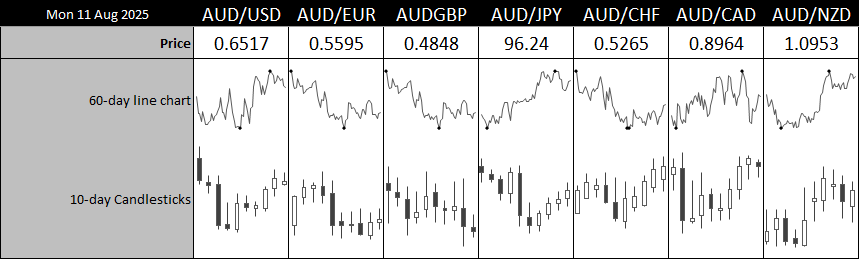
View related analysis:
View related analysis:
AUD/USD Steady Ahead of RBA Cut, US CPI Looms Large
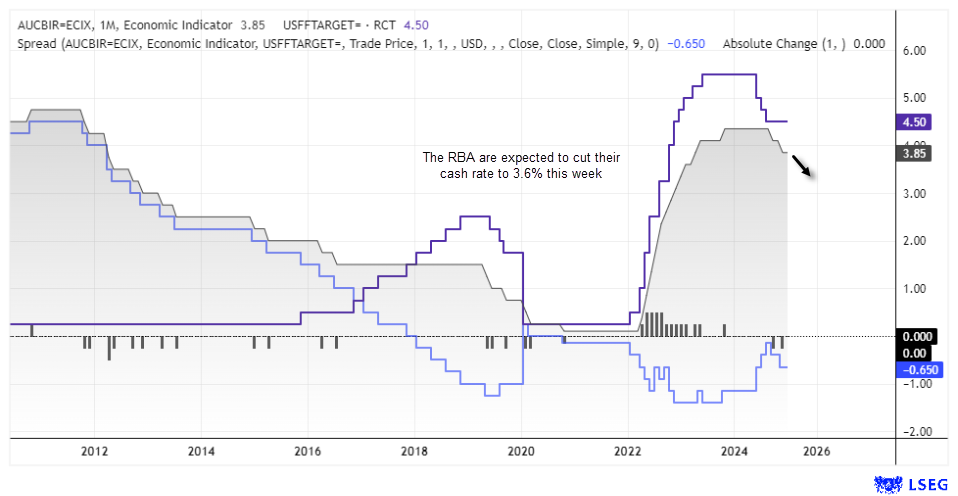
RBA Set for a Cautious 25bp Cut
The RBA is poised to trim the cash rate by 25bp to 3.6% on Tuesday. Headline CPI has eased to 2.1% y/y, comfortably within the RBA’s 2–3% target, while unemployment has risen to 4.3%. Despite this, the Bank is unlikely to deliver an overtly dovish cut.
RBA cash rate futures are pricing a 51% chance of a larger 50bp move — a scenario that seems unlikely given the Bank’s gradualist approach. The updated Statement on Monetary Policy is expected to keep medium-term inflation forecasts unchanged at 2.6%, reinforcing a measured policy path.
All considered, I expect a cautious 25bp cut on Tuesday, with the Bank keeping any dovish enthusiasm firmly in check.
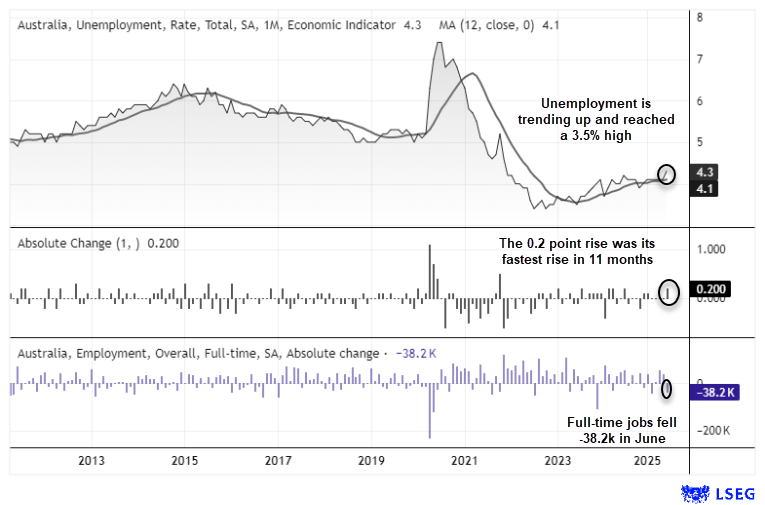
Australian Wages and Jobs in Focus Post-RBA
The wage price index (WPI) on Wednesday and Thursday’s employment report follow the RBA decision. A cautious cut paired with weak jobs data could strengthen the dovish case for another move in October or December. With full-time employment already down by 38.2k and unemployment at a 3.5-year high, AUD bears will be watching for fresh downside catalysts.
US CPI – The Main Event for USD Traders
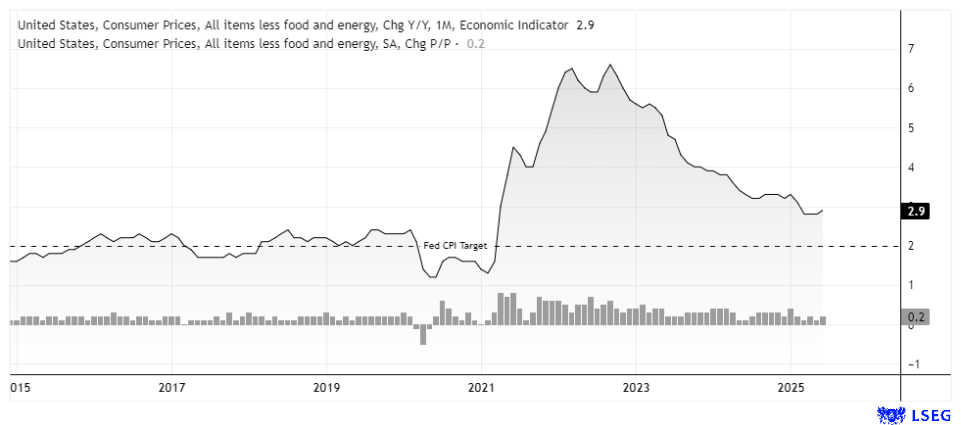
US CPI on Tuesday could be the deciding factor for September Fed policy. Core CPI rose 0.2% m/m in June to 2.9% y/y, but a print at 3% or higher could undermine expectations for an imminent cut. Such a surprise would likely boost the US dollar and weigh on AUD/USD, especially given the pair’s strong negative correlation with the DXY (-0.86 over the past 10 days).
COT Positioning – AUD/USD Futures
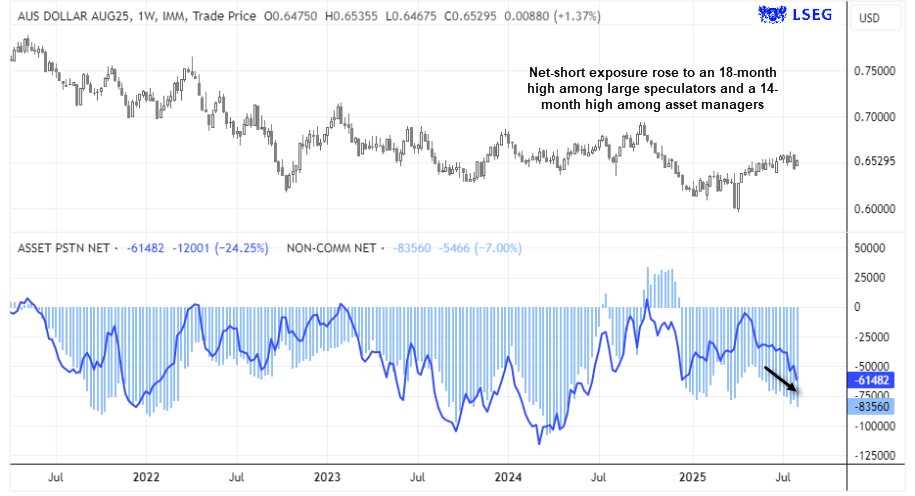
CFTC data shows net-short AUD/USD positions have climbed to multi-month highs, with large speculators and asset managers both heavily short. The recent bearish outside week suggests sellers are in control — but if AUD/USD holds firm post-RBA, short covering could trigger a rally towards 0.66.
AUD/USD Correlations:
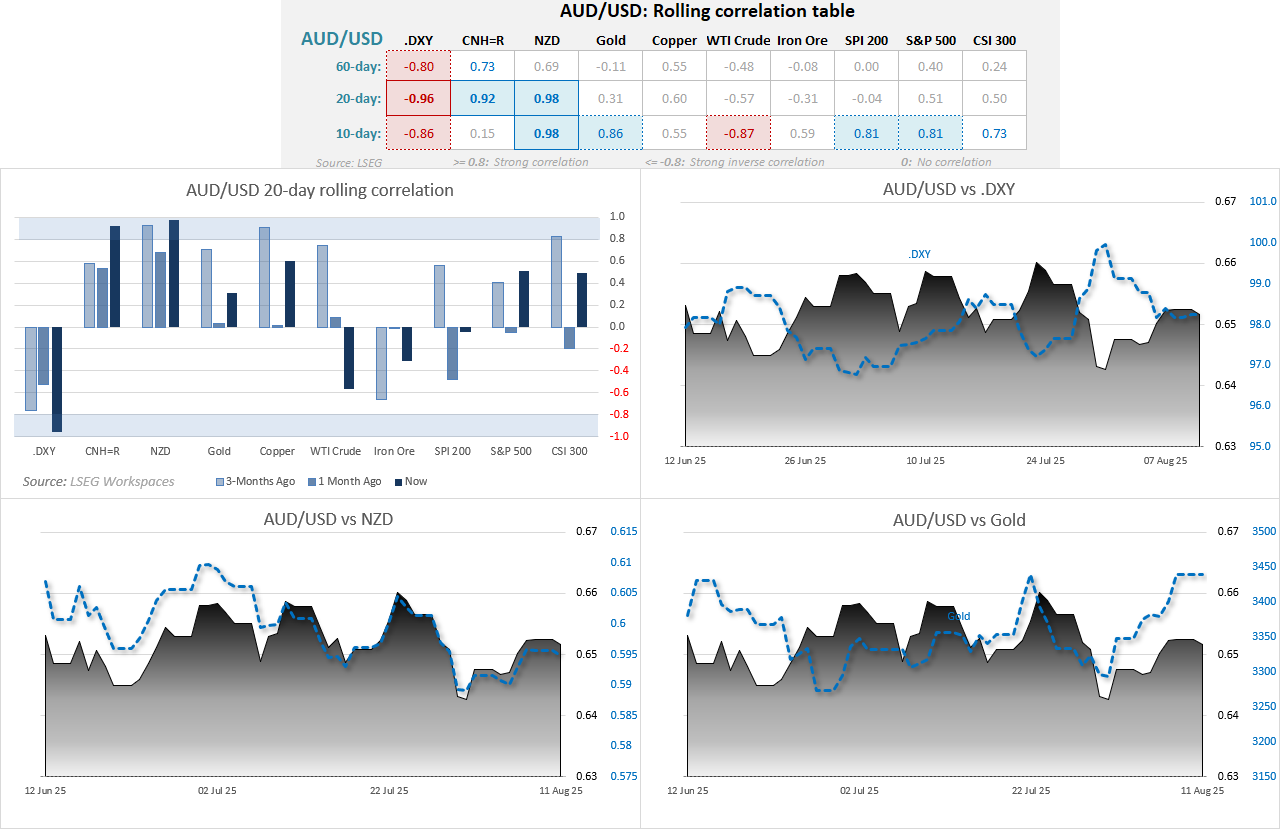
The Australian dollar has held its strongest correlation with the New Zealand dollar over the past 10- and 20-day periods. Tomorrow’s RBA meeting could provide the catalyst for a divergence between the two. While the 10-day inverted correlation between AUD/USD and the USD Index has eased slightly, it remains strong at -0.86.
The 10-day correlation between the Aussie and the Chinese yuan (CNH) has collapsed over the past fortnight, although it remains strong over the 20-day lookback and generally firm over the 60-day. A rebound in that shorter-term correlation over the coming week wouldn’t be surprising.
AUD/USD Technical Outlook
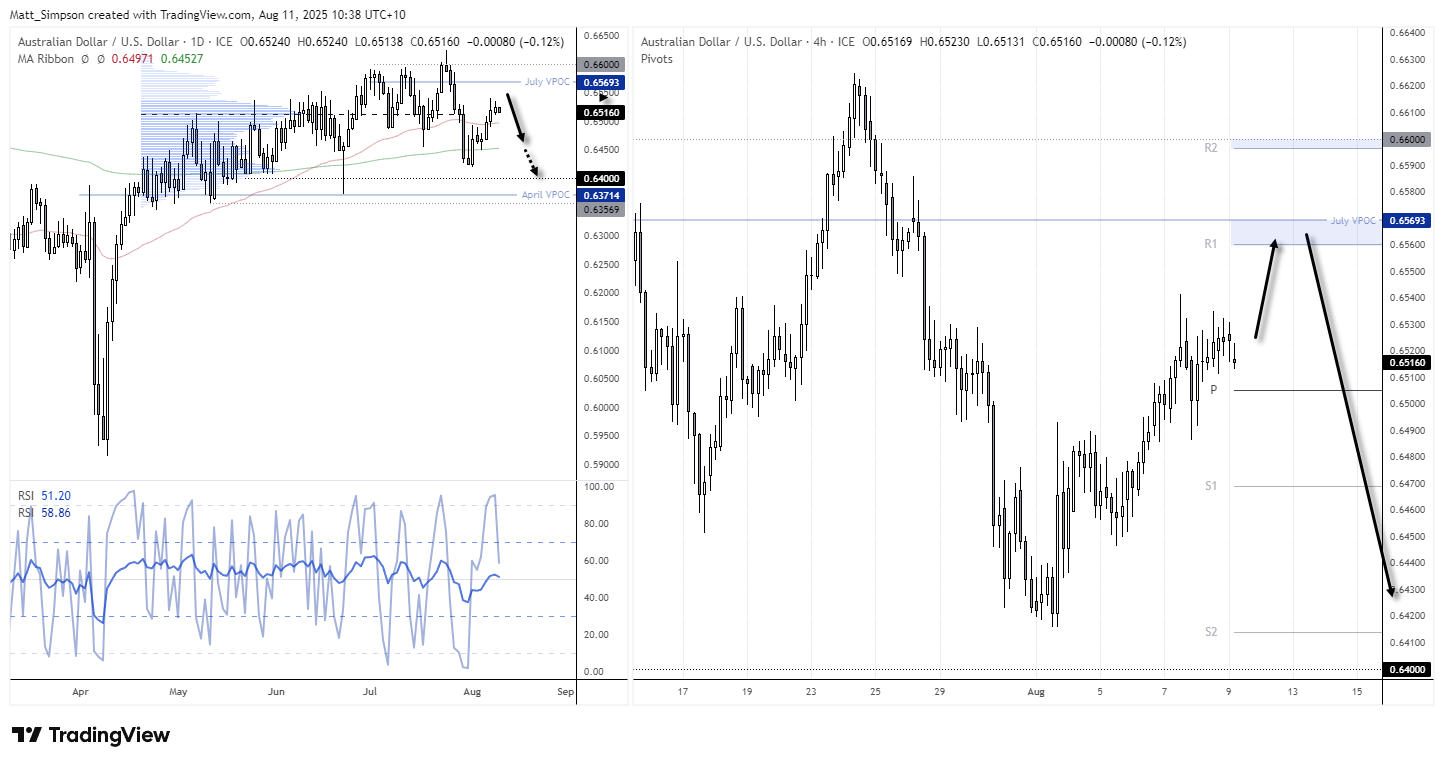
AUD/USD has risen nearly 2% from its recent cycle low, but resistance looms near 0.6560 (weekly R1) and 0.6593 (July VPOC). The weekly chart’s bearish engulfing pattern points to a potential swing high forming, with bears targeting a retest of the 200-day EMA at 0.6452.
For bulls to take control, the RBA would need to surprise by holding rates or delivering a cut without dovish guidance, while US CPI would have to come in soft enough to reinforce expectations of another Fed cut this year.
View the full economic calendar
View the full economic calendar
-- Written by Matt Simpson
Follow Matt on Twitter @cLeverEdge
How to trade with City Index
You can trade with City Index by following these four easy steps:
- Open an account, or log in if you’re already a customer
• Open an account in the UK
• Open an account in Australia
• Open an account in Singapore
- Search for the market you want to trade in our award-winning platform
- Choose your position and size, and your stop and limit levels
- Place the trade




Open an account in minutes
Experience award-winning platforms with fast and secure execution, and enjoy tight spreads from 0.5 pts on FX and 0.3 pts on indices.
Economic calendar
Web Trader platform
Our sophisticated web-based platform is packed with features.
Related articles

USD/JPY Forecast: Is Rising Japanese Inflation Supporting the Yen?
As the trading week comes to an end, one of the most relevant developments in the FX market has been the renewed strength of the Japanese yen. This can be seen in the recent performance of USD/JPY, which has fallen nearly 1.0% over the last two trading sessions, highlighting a meaningful recovery in the Japanese currency against the U.S. dollar.


Australian Dollar Forecast: AUD/USD Support Reversal Sparks Monthly Range Breakout 10 23 2026
A sharp reversal off key support has fueled the AUD/USD recovery, with resistance now in focus ahead of next week’s Fed decision and Australian CPI.

USD/JPY, Nikkei Break Lower as AI Meltdown Spreads
Thursday’s tech tantrum has become Friday’s fire sale. With Nikkei support giving way and the yen strengthening, could the selling start feeding on itself?

This report is intended for general circulation only. It should not be construed as a recommendation, or an offer (or solicitation of an offer) to buy or sell any financial products. The information provided does not take into account your specific investment objectives, financial situation or particular needs. Before you act on any recommendation that may be contained in this report, independent advice ought to be sought from a financial adviser regarding the suitability of the investment product, taking into account your specific investment objectives, financial situation or particular needs.
StoneX Financial Pte. Ltd., may distribute reports produced by its respective foreign entities or affiliates within the StoneX group of companies or third parties pursuant to an arrangement under Regulation 32C of the Financial Advisers Regulations. Where the report is distributed to a person in Singapore who is not an accredited investor, expert investor or an institutional investor (as defined in the Securities Futures Act), StoneX Financial Pte. Ltd. accepts legal responsibility to such persons for the contents of the report only to the extent required by law. Singapore recipients should contact StoneX Financial Pte. Ltd. at 6826 9988 for matters arising from, or in connection with the report.
In the case of all other recipients of this report, to the extent permitted by applicable laws and regulations neither StoneX Financial Pte. Ltd. nor its associated companies will be responsible or liable for any loss or damage incurred arising out of, or in connection with, any use of the information contained in this report and all such liability is hereby expressly disclaimed. No representation or warranty is made, express or implied, that the content of this report is complete or accurate.
StoneX Financial Pte. Ltd. is not under any obligation to update this report.
Trading CFDs carries a high level of risk that may not be suitable for some investors. Consider your investment objectives, level of experience, financial resources, risk appetite and other relevant circumstances carefully. The possibility exists that you could lose some or all of your investments, including your initial deposits. If in doubt, please seek independent expert advice. Visit www.forex.com/en-sg/terms-and-policies for the complete Risk Disclosure Statement.