



Bitcoin bears load up above a key support level – JPY and CNH in focus
Using bitcoin futures we can see that Bitcoin traders aggressively went short just above the year to date low. Now we wait to see if it breaks…
Share this:

It was another bearish session for crypto traders yesterday as the US dollar and yields continued higher whilst Wall Street and sentiment in general moved lower. And that has driven Bitcoin down to a key support, otherwise known as its YTD low on the futures charts.
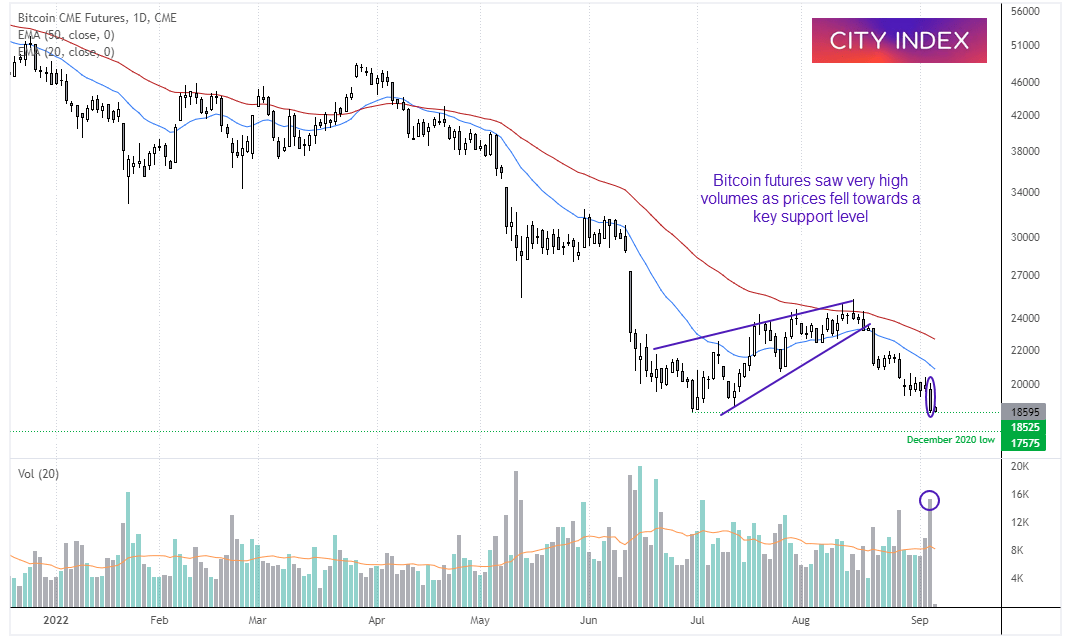
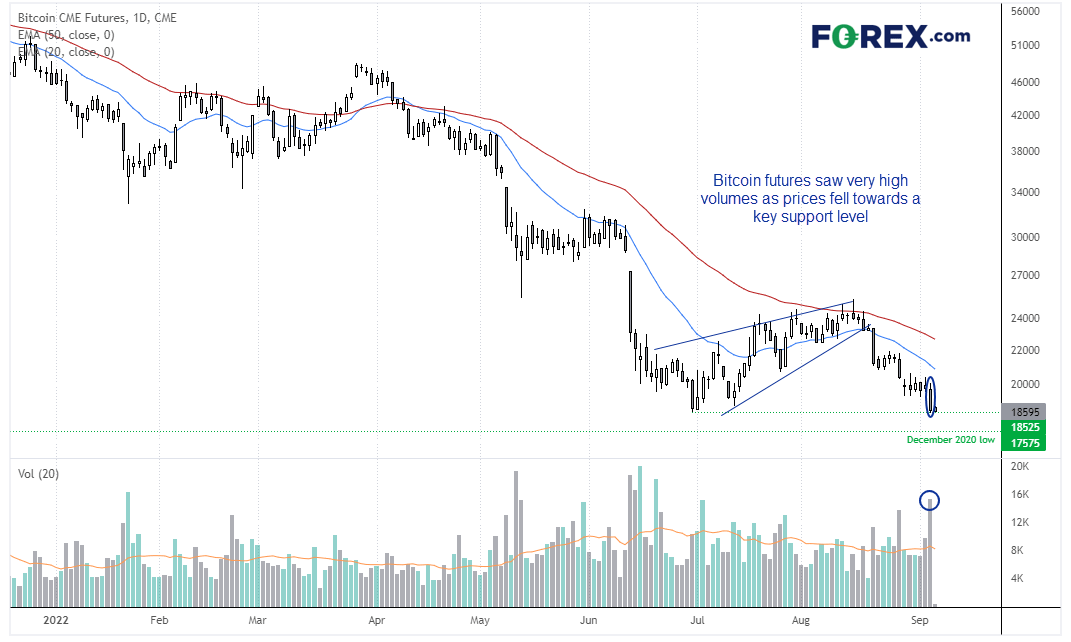
The daily chart is clearly within a downtrend, and prices broke out of a small consolidation yesterday and reached a bearish target projected form a rising wedge pattern. However, what has really grabbed my attention is how volumes were rising into the YTD low (18,525) which suggests bears were loading up in anticipation of a bearish breakout.
With bears having clearly made their intensions known, it could prompt further selling should prices break this key support level. Yet to counter that, should we see a false break and / or reversal higher, it could also prompt those pre-emptive bears to close out and create another leg higher. In short, volatility is likely to be on the horizon whichever way it moves from here.
Keep an eye on the intermarket relationships
Clearly a relatively large component of Bitcoin’s demise has also been the surging US dollar. But other factors are also at play. We can see that USD/JPY and USD/CNH have shared a very strong (inverted) correlation with Bitcoin since early August, where each break higher on these pairs is usually accompanied with a move lower for Bitcoin, more or less around the same time. It’s therefore worth keeping a close eye on these markets to help gauge the likelihood of Bitcoin continuing to move lower.
Pay close attention to what BOJ, MOF or PBOC say about their currencies
At the time of writing, USD/JPY trades above 143 for the first time since 1998 and is attempting to move to 144. USD/CNH has also risen to its highest level since August 2020 and is currently within its seventh bullish month. Yet the higher these pairs move, the greater the risk of some sort of intervention from their respective central banks.
Japan Minster of Finance has been hitting the wires this week to remind markets that’s its not desirable for FX markets to move too rapidly. As the BOJ quite like a weak currency, it means a rising USD/JPY should be ok as long as its speed is not too fast. Given the yen has depreciated against the US dollar by ~25% this year already, and the Minster of Finance is getting fidgety, we may be closer to FX intervention than some would like to believe.
Furthermore, the PBOC (People’s Bank of China) announced this week that they will cut the FX reserve ratio for banks to help reduce the depreciation of their currency. It’s not due to take effect until September the 15th, so this does allow for USD/CNH to continue higher.
Bitcoin 1-hour chart:


We can see on the 1-hour chart that bears stepped in ahead of a break below 1900 and prices have so far remained beneath it. There seems to be no immediate appetite for a break of the YTD low with volumes almost non-existent, so the longer that key level holds the greater the odds favour a correction higher.
Therefore, I suspect any low-volatility retracement towards 1900 / the resistance zone just above it might tempt fresh shorts to enter. At which point we could seek evidence of a lower high for a potential swig trade. A break beneath yesterday’s lows brings $1800 into focus, a break of shifts our attention to the December low around 17,575.
How to trade with City Index
You can easily trade with City Index by using these four easy steps:
- Open an account, or log in if you’re already a customer
• Open an account in the UK
• Open an account in Australia
• Open an account in Singapore
- Search for the company you want to trade in our award-winning platform
- Choose your position and size, and your stop and limit levels
- Place the trade
How to trade with FOREX.com
Follow these easy steps to start trading with FOREX.com today:
- Open a Forex.com account, or log in if you’re already a customer.
- Search for the pair you want to trade in our award-winning platform.
- Choose your position and size, and your stop and limit levels.
- Place the trade.
Related tags:


Open an account in minutes
Experience award-winning platforms with fast and secure execution, and enjoy tight spreads from 0.5 pts on FX and 0.3 pts on indices.
Economic calendar
Web Trader platform
Our sophisticated web-based platform is packed with features.
Related articles
Gold forecast: XAU/USD continues to coil as support holds again
Gold is being pulled in two directions by the same macro force: inflation. Persistent price pressures should, in theory, strengthen demand for the metal as a store of value. But if inflation proves sticky enough to keep central banks hawkish, the resulting rise in real and nominal yields makes gold less attractive at the margin.

Swiss Franc Technical Outlook: USD/CHF Reversal Puts Major Support in Focus 10 21 2026
USD/CHF bears are looking to build on last week’s sharp reversal, with a looming support test threatening the broader recovery.


UAE MSCI and S&P 500 Outlook: Key Levels to Watch
Price action in both the UAE MSCI and S&P 500 has been consolidating for several months, leaving each market at a key technical juncture. The direction of any breakout could offer insight into the health of UAE and US markets as risk sentiment remains subdued, crude oil prices stay elevated, and major earnings reports and elections approach.

This report is intended for general circulation only. It should not be construed as a recommendation, or an offer (or solicitation of an offer) to buy or sell any financial products. The information provided does not take into account your specific investment objectives, financial situation or particular needs. Before you act on any recommendation that may be contained in this report, independent advice ought to be sought from a financial adviser regarding the suitability of the investment product, taking into account your specific investment objectives, financial situation or particular needs.
StoneX Financial Pte. Ltd., may distribute reports produced by its respective foreign entities or affiliates within the StoneX group of companies or third parties pursuant to an arrangement under Regulation 32C of the Financial Advisers Regulations. Where the report is distributed to a person in Singapore who is not an accredited investor, expert investor or an institutional investor (as defined in the Securities Futures Act), StoneX Financial Pte. Ltd. accepts legal responsibility to such persons for the contents of the report only to the extent required by law. Singapore recipients should contact StoneX Financial Pte. Ltd. at 6826 9988 for matters arising from, or in connection with the report.
In the case of all other recipients of this report, to the extent permitted by applicable laws and regulations neither StoneX Financial Pte. Ltd. nor its associated companies will be responsible or liable for any loss or damage incurred arising out of, or in connection with, any use of the information contained in this report and all such liability is hereby expressly disclaimed. No representation or warranty is made, express or implied, that the content of this report is complete or accurate.
StoneX Financial Pte. Ltd. is not under any obligation to update this report.
Trading CFDs carries a high level of risk that may not be suitable for some investors. Consider your investment objectives, level of experience, financial resources, risk appetite and other relevant circumstances carefully. The possibility exists that you could lose some or all of your investments, including your initial deposits. If in doubt, please seek independent expert advice. Visit www.forex.com/en-sg/terms-and-policies for the complete Risk Disclosure Statement.