



Bitcoin Do Volatile Bullish Sessions Lead To Further Gains
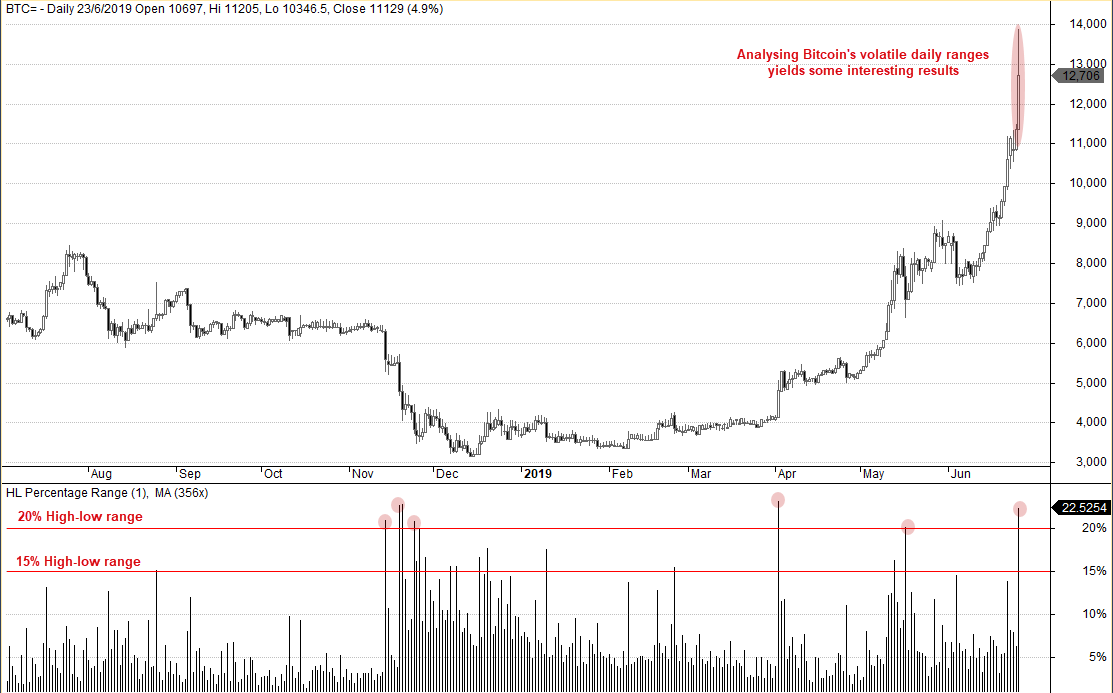
Bitcoin has been grabbing the limelight once more as it breaks through key levels like a knife through butter. Having travelled 20% yesterday alone, we've analysed how the crypto currency has performed on previous occasions following such levels of volatility.
Share this:

Bitcoin has been grabbing the limelight once more as it breaks through key levels like a knife through butter. Having travelled 20% yesterday alone, we've analysed how the crypto currency has performed on previous occasions following such levels of volatility.
It’s no secret the Bitcoin (BTC) and other crypto currencies are highly volatile vehicles, which can post eye watering numbers when compared with other instruments. For example, BTC has rallied over 80% since the June low just three ago, and even this pales in comparison to 326% appreciation since December’s low to yesterday’s high. Just yesterday, Bitcoin’s daily range exceeded 20%, a threshold which could be the difference between a bull or a bear market to other assets. With that in mind, we’ll take a closer look at how Bitcoin has behaved under such volatile conditions.
Using data going since July 2014:
- There have been 38 sessions where Bitcoin’s daily range was >=20%.
- Of these 38 days, 36.9% were bullish (63.2% were bearish)
- From this sample, the largest bullish close was 22.4% (largest bearish day was -24.5%)
From this we see that:
- Nearly 2/3 of daily ranges >=20% were bearish
- The most bullish day from the sample was larger than the most bearish
- Such levels of single-day volatility have been favourable to the bear-camp.
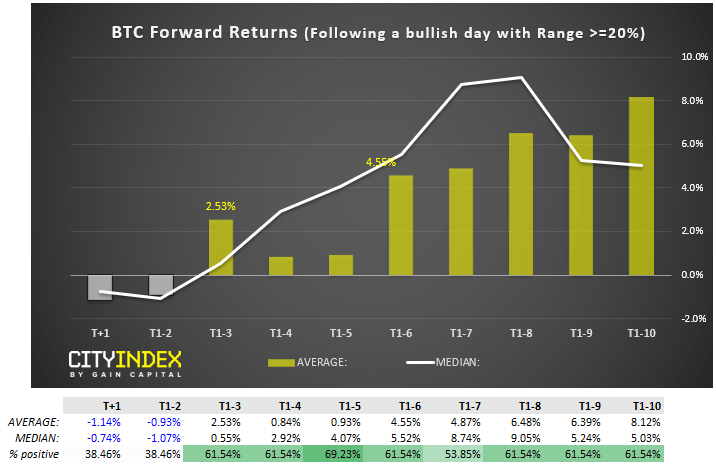
However, as the trend is undeniably bullish and yesterday closed nearly 12% higher, we’d like to drill down into the data to see Bitcoins forward returns following bullish days with a range >=20%. For clarity, forward returns measure the performance of a market following a particular event, using historical data.
T+1: % return next day
T+1-2: % Returns over the next 2 days
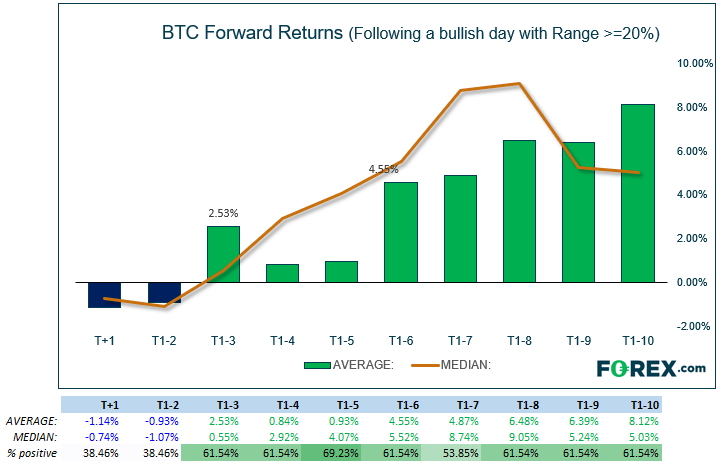
Following bullish days with a high-low range >= 20%:
- On average, the following day produced negative returns of -1.14%, and closed lower 61.5% of the time
- After two days, bitcoin averaged -0.93% return and closed lower 61.5% of the time
- On average, positive returns were seen with hold times between 3 and 10 days after the event
- Typically, the average return increases over time towards a 10-day hold after the event
- Average returns peaked after 10-days of holding
- Media (typical returns) peak around 8 days later (just over a week)
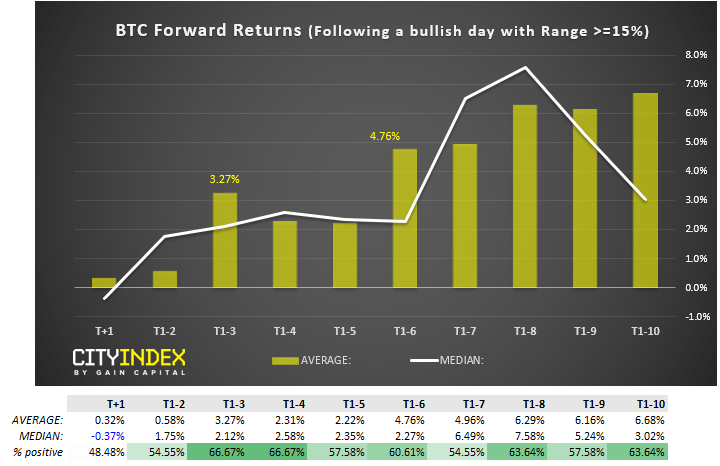
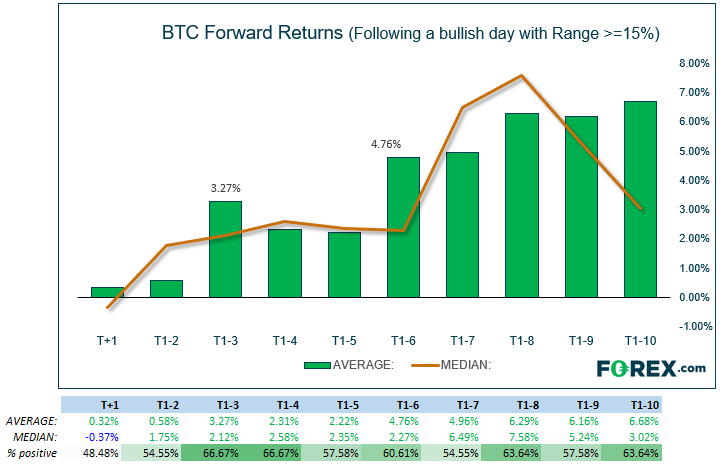
It’s worth noting at this stage that there have only been 13 days that fit our criteria. Statistically speaking, we’d want at least 30 occurrences at a minimum to be confident the results were valid. However, if we drop the threshold to 15% high-low range, the sample size becomes 33 and similar patterns emerge.
Following bullish days with a high-low range >= 15%:
- On average, all holding periods produced a positive return
- 10-days holding period produced the highest, average return
- Median (typical) average return peaks at 8 days
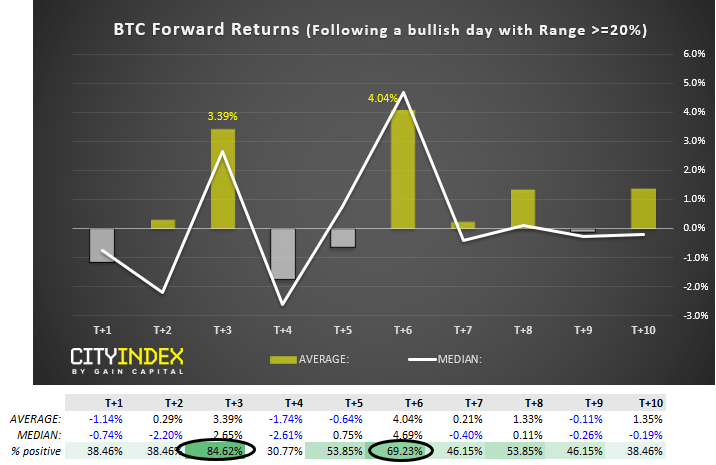
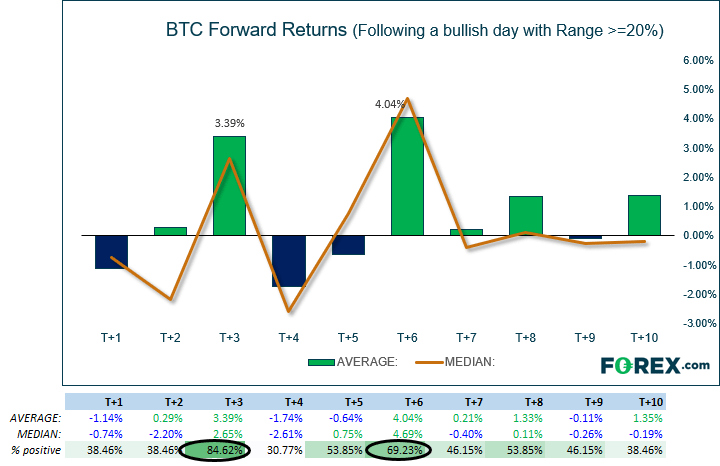
And, to drill down a little further, we look at average returns on a day by day basis.
Following bullish days with a high-low range >= 20%:
- The highest % return occurred on day 6 (T+6)
- The 2nd highest % return occurred on day 3 (T+3)
- The 3rd day closed higher 84.6% of the time
- The 6th day closed higher 69.2% of the time
So from this data-set, day 3 and 6 after the event were the most profitable. And if we re-run the test using a >=15% threshold (to increase the sample to 33) then the results are similar, only the returns are smaller.
Key Takeaway:
Overall, it suggests that on average, bullish sessions with a range >=15% or >=20% lead to a positive return on day 3 or 6. Furthermore, holding between days 3 to 10 yields an increasing positive return.
Of course, past results are not indicative of the future – but there are some interesting numbers here none the less.
Related Analysis:
What to do about Bitcoin
Bitcoin backing up
Can the Bitcoin rally last this time?
Bitcoin has been grabbing the limelight once more as it breaks through key levels like a knife through butter. Having travelled 20% yesterday alone, we've analysed how the crypto currency has performed on previous occasions following such levels of volatility.
It’s no secret the Bitcoin (BTC) and other crypto currencies are highly volatile vehicles, which can post eye watering numbers when compared with other instruments. For example, BTC has rallied over 80% since the June low just three ago, and even this pales in comparison to 326% appreciation since December’s low to yesterday’s high. Just yesterday, Bitcoin’s daily range exceeded 20%, a threshold which could be the difference between a bull or a bear market to other assets. With that in mind, we’ll take a closer look at how Bitcoin has behaved under such volatile conditions.
Using data going since July 2014:
- There have been 38 sessions where Bitcoin’s daily range was >=20%.
- Of these 38 days, 36.9% were bullish (63.2% were bearish)
- From this sample, the largest bullish close was 22.4% (largest bearish day was -24.5%)
From this we see that:
- Nearly 2/3 of daily ranges >=20% were bearish
- The most bullish day from the sample was larger than the most bearish
- Such levels of single-day volatility have been favourable to the bear-camp.
However, as the trend is undeniably bullish and yesterday closed nearly 12% higher, we’d like to drill down into the data to see Bitcoins forward returns following bullish days with a range >=20%. For clarity, forward returns measure the performance of a market following a particular event, using historical data.
T+1: % return next day
T+1-2: % Returns over the next 2 days
Following bullish days with a high-low range >= 20%:
- On average, the following day produced negative returns of -1.14%, and closed lower 61.5% of the time
- After two days, bitcoin averaged -0.93% return and closed lower 61.5% of the time
- On average, positive returns were seen with hold times between 3 and 10 days after the event
- Typically, the average return increases over time towards a 10-day hold after the event
- Average returns peaked after 10-days of holding
- Median (typical returns) peak around 8 days later (just over a week)
It’s worth noting at this stage that there have only been 13 days that fit our criteria. Statistically speaking, we’d want at least 30 occurrences at a minimum to be confident the results were valid. However, if we drop the threshold to 15% high-low range, the sample size becomes 33 and similar patterns emerge.
Following bullish days with a high-low range >= 15%:
- On average, all holding periods produced a positive return
- 10-days holding period produced the highest, average return
- Median (typical) average return peaks at 8 days
And, to drill down a little further, we look at average returns on a day by day basis.
Following bullish days with a high-low range >= 20%:
- The highest % return occurred on day 6 (T+6)
- The 2nd highest % return occurred on day 3 (T+3)
- The 3rd day closed higher 84.6% of the time
- The 6th day closed higher 69.2% of the time
So from this data-set, day 3 and 6 after the event were the most profitable. And if we re-run the test using a >=15% threshold (to increase the sample to 33) then the results are similar, only the returns are smaller.
Key Takeaway:
Overall, it suggests that on average, bullish sessions with a range >=15% or >=20% lead to a positive return on day 3 or 6. Furthermore, holding between days 3 to 10 yields an increasing positive return.
Of course, past results are not indicative of the future – but there are some interesting numbers here none the less.
Related Analysis:
Can the Bitcoin rally last this time?
Bitcoin Hesitates Around $11k
Related tags:




Open an account in minutes
Experience award-winning platforms with fast and secure execution, and enjoy tight spreads from 0.5 pts on FX and 0.3 pts on indices.
Economic calendar
Web Trader platform
Our sophisticated web-based platform is packed with features.
Related articles

Gold Dips Below Three-Month Uptrend, Bitcoin Pulls Back from Nine-Month High
Gold has dipped below its three-month uptrend, while Bitcoin has pulled back from a nine-month high as U.S. bond yields test levels last seen in 2004 and 2007. Risks build as Fed rate-hike expectations remain above 70%, while the Dollar Index holds near yearly highs.


Q4 2026 Bitcoin Outlook: Did the August Rally Mark the Cycle Low?
The outlook for Bitcoin in Q4 is turning cautiously optimistic on the back of renewed ETF purchases, compelling valuations, and an improvement in buy-and-hold behavior among investors - see the full analysis!


Bitcoin Technical Outlook: BTC/USD Major Breakout Signals Crypto Winter May Be Over 9 22 2026
A 50% surge from the yearly low has transformed Bitcoin’s technical backdrop, with bulls now targeting the next major hurdle at the yearly open.

This report is intended for general circulation only. It should not be construed as a recommendation, or an offer (or solicitation of an offer) to buy or sell any financial products. The information provided does not take into account your specific investment objectives, financial situation or particular needs. Before you act on any recommendation that may be contained in this report, independent advice ought to be sought from a financial adviser regarding the suitability of the investment product, taking into account your specific investment objectives, financial situation or particular needs.
StoneX Financial Pte. Ltd., may distribute reports produced by its respective foreign entities or affiliates within the StoneX group of companies or third parties pursuant to an arrangement under Regulation 32C of the Financial Advisers Regulations. Where the report is distributed to a person in Singapore who is not an accredited investor, expert investor or an institutional investor (as defined in the Securities Futures Act), StoneX Financial Pte. Ltd. accepts legal responsibility to such persons for the contents of the report only to the extent required by law. Singapore recipients should contact StoneX Financial Pte. Ltd. at 6826 9988 for matters arising from, or in connection with the report.
In the case of all other recipients of this report, to the extent permitted by applicable laws and regulations neither StoneX Financial Pte. Ltd. nor its associated companies will be responsible or liable for any loss or damage incurred arising out of, or in connection with, any use of the information contained in this report and all such liability is hereby expressly disclaimed. No representation or warranty is made, express or implied, that the content of this report is complete or accurate.
StoneX Financial Pte. Ltd. is not under any obligation to update this report.
Trading CFDs carries a high level of risk that may not be suitable for some investors. Consider your investment objectives, level of experience, financial resources, risk appetite and other relevant circumstances carefully. The possibility exists that you could lose some or all of your investments, including your initial deposits. If in doubt, please seek independent expert advice. Visit www.forex.com/en-sg/terms-and-policies for the complete Risk Disclosure Statement.