



Bitcoin Price Forecast: BTC/USD 26% Surge Rejected – Breakdown Risk Builds
Bitcoin’s rebound has hit a ceiling after an eight-day rally with price pulling back sharply from resistance. Trend to be decided at upcoming support.
Share this:

Bitcoin Technical Forecast: BTC/USD Weekly & Daily Trade Levels
- BTC/USD rallied more than 26% from the February low before stalling at a major resistance zone tied to prior breakdown levels.
- The rejection snapped an eight-day advance and has already triggered a pullback from the weekly highs.
- A sustained move below near-term support would confirm resumption of the broader downtrend, while a recovery above resistance is needed to shift momentum back in favor of the bulls.
Bitcoin’s recovery from February lows has stalled after running into a well-defined resistance zone, halting the strongest rally of the year. The rejection from this area has shifted attention back to support levels, where the market will need to hold to avoid reigniting downside pressure. While the rebound improved near-term momentum, the broader structure remains fragile unless buyers can reclaim lost ground. The coming sessions are likely to determine whether this move was a temporary bounce or the start of a more sustained recovery attempt. Battle lines drawn on the BTC/USD technical charts.
Review my latest Weekly Strategy Webinar for an in-depth breakdown of this Bitcoin setup and more. Join live on Monday’s at 8:30am EST.
Bitcoin Price Chart – BTC/USD Weekly
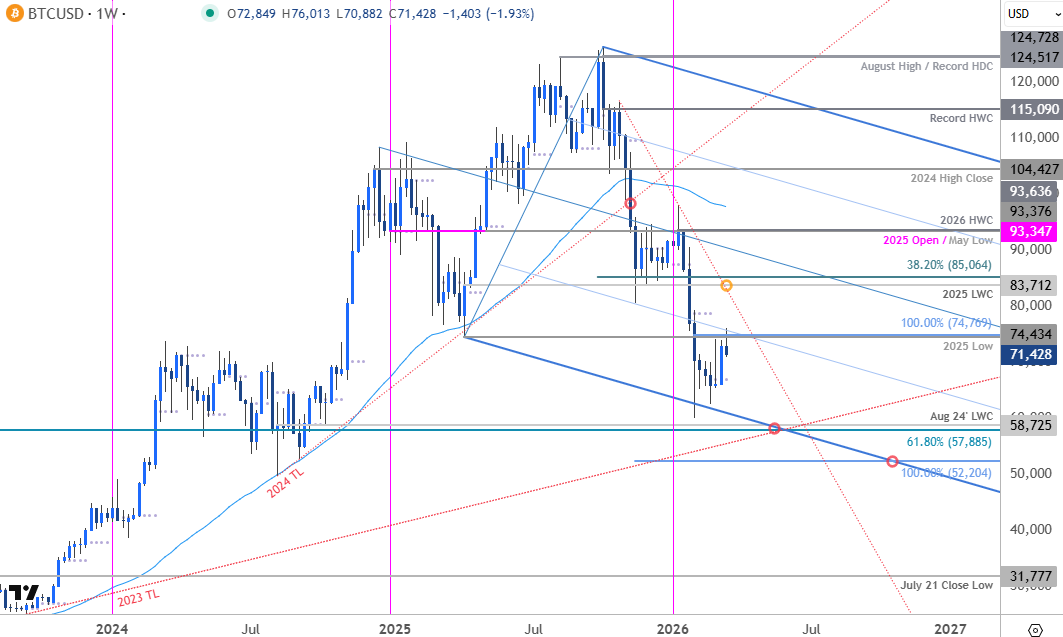
Chart Prepared by Michael Boutros, Sr. Technical Strategist; BTC/USD on TradingView
In last month’s Cryptocurrency Forecast we noted that Bitcoin was, “attempting its first meaningful recovery since the January sell-off and the immediate focus is on potential inflection near 70,238/531 IF reached. A close above would keep the near-term focus higher in BTC/USD. From a trading standpoint, rallies would need to be limited to 76,159 for the October downtrend to remain viable with a close below 62,795 needed to fuel the next leg of the decline.” Bitcoin rallied more than 26% off the February low with the advance exhausting into key resistance yesterday at 74,434-76,159- a region defined by the 2025 low, the 100% extension of the February rally, and the 2025 low-close. Note that the 25% parallel converges on this zone and keeps price within the lower band of the 2025 pitchfork. The bulls remain vulnerable while below this slope with BTC/USD already off more than 6.7% from the weekly high.

Bitcoin Price Chart – BTC/USD Daily
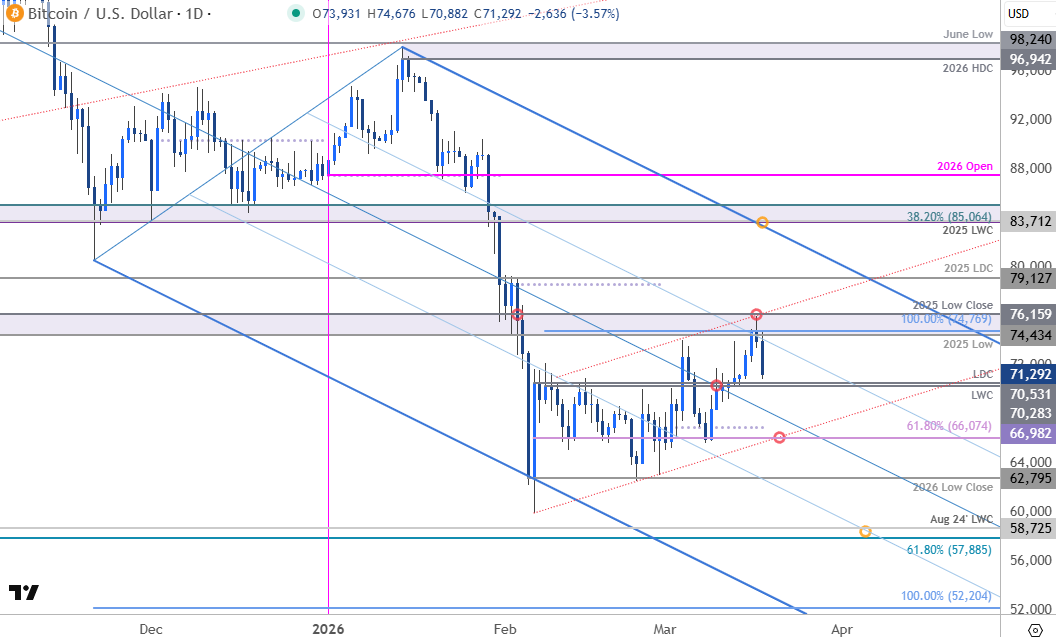
Chart Prepared by Michael Boutros, Sr. Technical Strategist; BTC/USD on TradingView
A closer look at the Bitcoin daily chart shows the magnitude of the reversal after snapping an eight-day rally yesterday. Initial support is now in view at yearly low-week (LWC) / low-day close (LDC) at 70,283/531. Look for a reaction there IF reached. Ultimately, a break / daily close below the 61.8% retracement of the February rally and the March open at 66,074/982 would be needed to mark resumption of the broader downtrend. Subsequent support objectives rest with the yearly low-close at 62,795 backed by the 61.8% retracement of the 2022 advance at 57,885 and the 100% extension of the October decline at 52,204. Both these levels represent areas of interest for possible downside exhaustion / price inflection IF reached.
A breach / daily close above the February channel would be needed to suggest a more significant trend reversal is underway with subsequent resistance eyed at the 2025 low-day close (LDC) at 79,127. Broader bearish invalidation remains at the 2025 low-week close (LWC) and the 38.2% retracement of the October decline at 83,712-85,064. Strength surpassing this threshold is needed to invalidate the multi-month downtrend and put the bulls back in control.
Bottom line: Bitcoin has completed two-equal legs off the yearly lows and the correction within the broader downtrend may be complete here. From a trading standpoint, rallies would need to be limited to 76,159 IF price is heading lower on this stretch with a close below 66,074 needed to fuel the next major leg of the decline.
Active Weekly Technical Charts
- Euro (EUR/USD)
- US Dollar Index (DXY)
- Australian Dollar (AUD/USD)
- British Pound (GBP/USD)
- Gold (XAU/USD)
- Canadian Dollar (USD/CAD)
- S&P 500, Nasdaq, Dow
- Swiss Franc (USD/CHF)
- Crude Oil (WTI)
- Japanese Yen (USD/JPY)
--- Written by Michael Boutros, Senior Technical Strategist
Follow Michael on X @MBForex
Latest market news




Open an account in minutes
Experience award-winning platforms with fast and secure execution, and enjoy tight spreads from 0.5 pts on FX and 0.3 pts on indices.
Economic calendar
Web Trader platform
Our sophisticated web-based platform is packed with features.
Related articles
USD/JPY Weekly Outlook: AI earnings could overshadow the Fed and BoJ
AI sentiment has become a major driver of US Treasury yields and USD/JPY. With Microsoft, Alphabet and Amazon reporting this week, central bank decisions may have competition for traders' attention.
Australian Dollar Forecast: AUD/USD Support Reversal Sparks Monthly Range Breakout 10 23 2026
A sharp reversal off key support has fueled the AUD/USD recovery, with resistance now in focus ahead of next week’s Fed decision and Australian CPI.

Crude Oil Forecast: Weekend Iran Strike Fears Lift Oil Toward War Highs
Brent crude oil is accelerating above $110 as traders price in the risk of a US-Israeli strike on Iran over the weekend. How much more of a geopolitical premium can oil build in before the close?

This report is intended for general circulation only. It should not be construed as a recommendation, or an offer (or solicitation of an offer) to buy or sell any financial products. The information provided does not take into account your specific investment objectives, financial situation or particular needs. Before you act on any recommendation that may be contained in this report, independent advice ought to be sought from a financial adviser regarding the suitability of the investment product, taking into account your specific investment objectives, financial situation or particular needs.
StoneX Financial Pte. Ltd., may distribute reports produced by its respective foreign entities or affiliates within the StoneX group of companies or third parties pursuant to an arrangement under Regulation 32C of the Financial Advisers Regulations. Where the report is distributed to a person in Singapore who is not an accredited investor, expert investor or an institutional investor (as defined in the Securities Futures Act), StoneX Financial Pte. Ltd. accepts legal responsibility to such persons for the contents of the report only to the extent required by law. Singapore recipients should contact StoneX Financial Pte. Ltd. at 6826 9988 for matters arising from, or in connection with the report.
In the case of all other recipients of this report, to the extent permitted by applicable laws and regulations neither StoneX Financial Pte. Ltd. nor its associated companies will be responsible or liable for any loss or damage incurred arising out of, or in connection with, any use of the information contained in this report and all such liability is hereby expressly disclaimed. No representation or warranty is made, express or implied, that the content of this report is complete or accurate.
StoneX Financial Pte. Ltd. is not under any obligation to update this report.
Trading CFDs carries a high level of risk that may not be suitable for some investors. Consider your investment objectives, level of experience, financial resources, risk appetite and other relevant circumstances carefully. The possibility exists that you could lose some or all of your investments, including your initial deposits. If in doubt, please seek independent expert advice. Visit www.forex.com/en-sg/terms-and-policies for the complete Risk Disclosure Statement.