



Bitcoin, S&P 500 Outlook: Wall Street Volatility Rattles BTC
Wall Street’s sharp swings are shaking crypto markets, with the S&P 500 and Bitcoin both flashing signs of weakness after recent highs.
Share this:
Wall Street’s surge in volatility is reverberating through crypto markets, leaving Bitcoin bulls on edge. The S&P 500 endured its most turbulent session since April, while Bitcoin hovered near key support around 108 k. With correlations between Bitcoin, equities, and tech stocks strengthening, traders should watch for clues from Wall Street’s next move. A breakdown in equities could easily tip Bitcoin into a deeper correction.
View related analysis:
View related analysis:
Wall Street Volatility Threatens Bitcoin’s Uptrend
Bitcoin (BTC/USD) Futures Technical Analysis: Bitcoin vs US Dollar
The weekly chart shows that bitcoin bulls have enjoyed a strong rally from the November 2022 low to the August 2025 high. Yet the trend has paused for breath, with prices effectively ranging between 109k and 125k. The question now, of course, is whether we’ll see dip buyers emerge and send bitcoin to fresh highs, or if we’ve witnessed the early stages of a deeper pullback. To answer that, we should look at the relationship between bitcoin and Wall Street, alongside price action clues.
The size of the retracement so far is relatively shallow at just -14%, given the retracement from March to August 2024 was -32.5%, and the one seen in April was of similar size. But we have also seen three reversal candles form around my original bull-flag target, while trading volumes have steadily trended lower.
Bulls are likely to seek dips while bitcoin prices remain above the 108,590 low — but a break beneath that key level clearly paves the way for a deeper pullback.
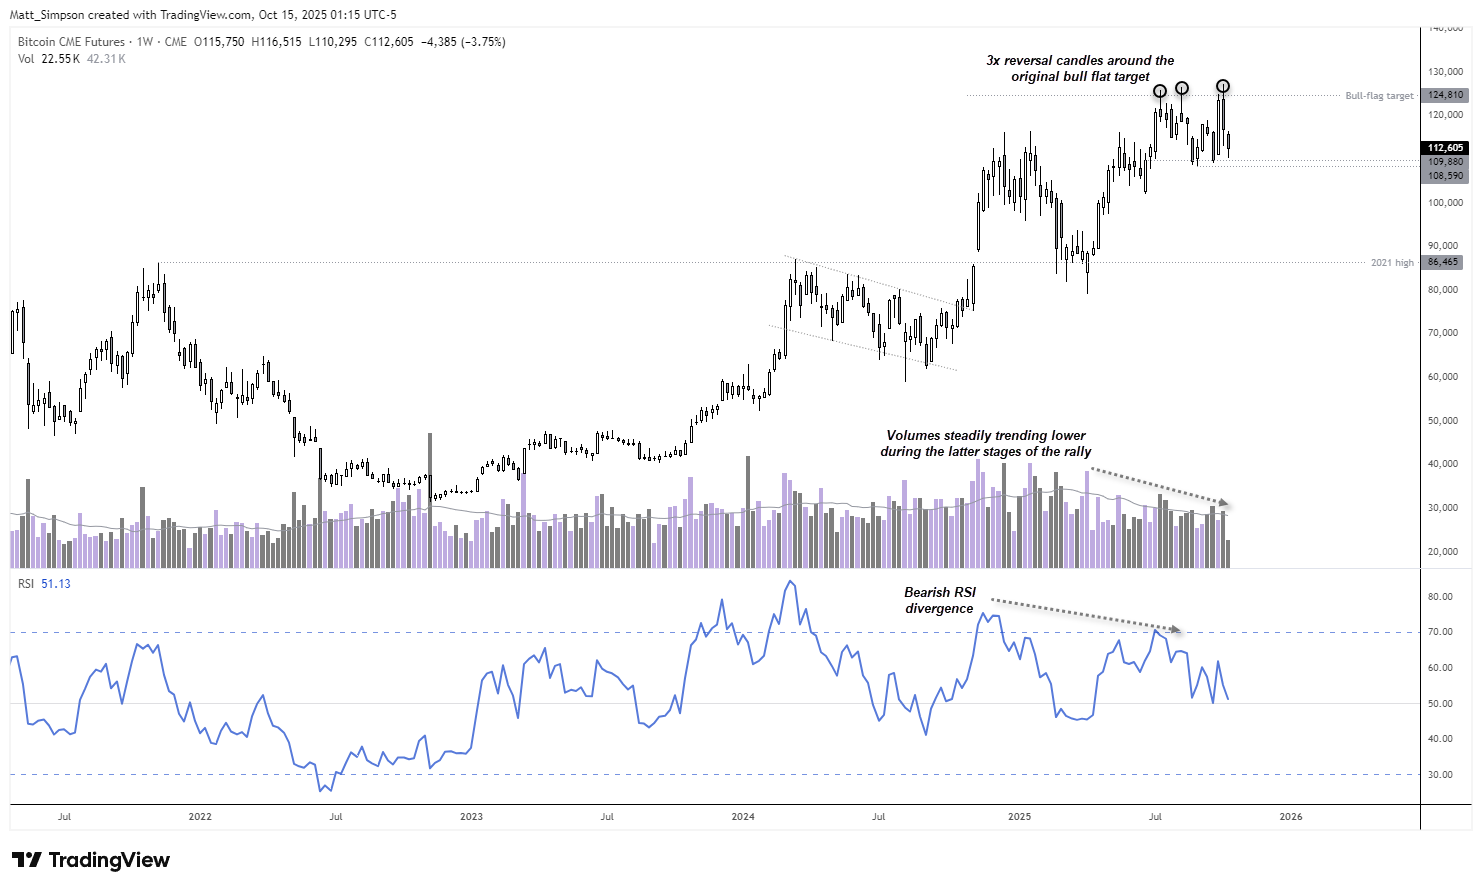
Chart analysis by Matt Simpson - data source: TradingView Bitcoin CME Futures (BTC1!)


Bitcoin (BTC/USD) Technical Analysis: Bitcoin vs US Dollar
Bitcoin has long shared a positive correlation with Wall Street indices, though its strength oscillates over time. Since becoming ‘institutionalised’ before COVID, bitcoin has effectively become another proxy for risk sentiment. I therefore doubt we’ll see the cryptocurrency break to new highs until Wall Street does — unless a sector-specific catalyst emerges.
While correlations are currently strongest between bitcoin, Ethereum, Ripple (XRP), and Solana, these cryptocurrencies typically follow bitcoin’s lead. And with correlations against the Nasdaq 100, S&P 500, and Nvidia’s share price strengthening over the past month, traders should keep a close eye on how these key indices perform. Unfortunately for bitcoin bulls, I suspect we’re witnessing a dead-cat bounce on Wall Street.

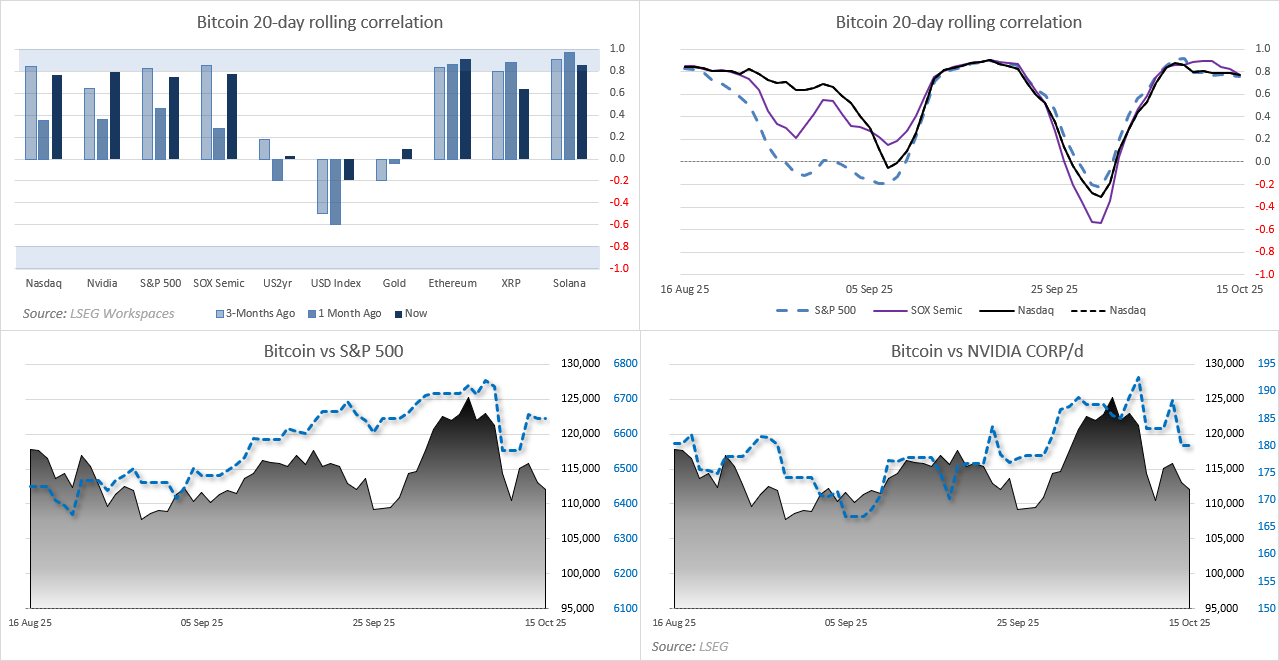
Chart analysis by Matt Simpson - Source: CME, LSEG
S&P 500 Futures (ES) Technical Analysis
Given that Wall Street indices suffered their most volatile session since April on Friday, it’s no surprise to see the S&P 500 meandering within that range. While prices are edging higher, the move appears corrective — suggesting the potential for another leg lower. Also note the bearish divergence on the RSI (14), which warns the S&P 500 could be setting up for a deeper pullback. And although the 50-day EMA held as support, it did so on the first meaningful test of this bullish run. I’m therefore watching for evidence of a swing high on the S&P 500.
The 1-hour chart shows that the largest volume spikes are all bearish. Perhaps S&P 500 bears will find that swing high forming near the 6,741 lows or around the weekly R1 pivot point at 6,758.

Chart analysis by Matt Simpson, Source: TradingView, CME Futures, S&P 500 E-mini Futures


Bitcoin (BTC/USD) Futures Daily Chart:
The daily chart shows a clear momentum shift to the downside from last week’s record high. It almost looks as though the preceding move was a ‘last hurrah’ from bulls, with sentiment now turning against them. The bias is for a break beneath recent swing lows and a move towards the 102k area once a lower high forms on the daily chart.
However, given several nearby support levels and the lower wick on Tuesday’s candle, a short-term bounce may be on the cards. Bulls could seek dips towards the September low and retain a near-term bullish bias while prices remain above 108k, targeting the 120k area.
Bears could either wait for a lower high to form on the daily chart or look for a break below 108k to assume bearish trend continuation.

Chart analysis by Matt Simpson - data source: TradingView Bitcoin CME Futures (BTC1!)
View the full economic calendar
View the full economic calendar
-- Written by Matt Simpson
Follow Matt on Twitter @cLeverEdge
How to trade with City Index
You can trade with City Index by following these four easy steps:
- Open an account, or log in if you’re already a customer
• Open an account in the UK
• Open an account in Australia
• Open an account in Singapore
- Search for the market you want to trade in our award-winning platform
- Choose your position and size, and your stop and limit levels
- Place the trade


Open an account in minutes
Experience award-winning platforms with fast and secure execution, and enjoy tight spreads from 0.5 pts on FX and 0.3 pts on indices.
Economic calendar
Web Trader platform
Our sophisticated web-based platform is packed with features.
Related articles

British Pound Outlook: GBP Recovery Mixed as BOE Hike Bets Rise
BOE hike bets are rising as the British pound recovers, with GBP strength most promising against the Australian and Canadian dollars.

Nasdaq 100 Analysis: NDX Returns to Record Highs
The new trading week is underway and the Nasdaq 100 is once again displaying a meaningful bullish bias in the short term. This can be seen in the index's recent performance, which has gained more than 2.1% over the last three trading sessions, returning once again to record-high territory.


EUR/USD forecast: Currency Pair of the Week | October 5, 2026
There’s not much in the way of data this week, meaning the EUR/USD forecast will be mainly driven by political and fiscal concerns, as well as the bond and oil markets.

This report is intended for general circulation only. It should not be construed as a recommendation, or an offer (or solicitation of an offer) to buy or sell any financial products. The information provided does not take into account your specific investment objectives, financial situation or particular needs. Before you act on any recommendation that may be contained in this report, independent advice ought to be sought from a financial adviser regarding the suitability of the investment product, taking into account your specific investment objectives, financial situation or particular needs.
StoneX Financial Pte. Ltd., may distribute reports produced by its respective foreign entities or affiliates within the StoneX group of companies or third parties pursuant to an arrangement under Regulation 32C of the Financial Advisers Regulations. Where the report is distributed to a person in Singapore who is not an accredited investor, expert investor or an institutional investor (as defined in the Securities Futures Act), StoneX Financial Pte. Ltd. accepts legal responsibility to such persons for the contents of the report only to the extent required by law. Singapore recipients should contact StoneX Financial Pte. Ltd. at 6826 9988 for matters arising from, or in connection with the report.
In the case of all other recipients of this report, to the extent permitted by applicable laws and regulations neither StoneX Financial Pte. Ltd. nor its associated companies will be responsible or liable for any loss or damage incurred arising out of, or in connection with, any use of the information contained in this report and all such liability is hereby expressly disclaimed. No representation or warranty is made, express or implied, that the content of this report is complete or accurate.
StoneX Financial Pte. Ltd. is not under any obligation to update this report.
Trading CFDs carries a high level of risk that may not be suitable for some investors. Consider your investment objectives, level of experience, financial resources, risk appetite and other relevant circumstances carefully. The possibility exists that you could lose some or all of your investments, including your initial deposits. If in doubt, please seek independent expert advice. Visit www.forex.com/en-sg/terms-and-policies for the complete Risk Disclosure Statement.