



Nasdaq, Crude Oil Plunge Amid Trump-Tariff Revival as Gold Holds Firm
Risk appetite collapsed on Friday after Trump reignited U.S.–China trade tensions with a threat of 100% tariffs, sending Wall Street and oil sharply lower while gold held firm near $4,000 on safe-haven demand.
Share this:

Markets were rocked on Friday as risk sentiment collapsed following President Trump’s surprise threat to impose a 100% tariff on Chinese goods. The move, paired with new U.S. export controls on critical software, reignited trade war fears and triggered a broad risk-off reaction across global markets. Equities and crude oil tumbled, volatility spiked to multi-month highs, and safe-haven assets such as gold and the Japanese yen found strong support ahead of Monday’s open.
View related analysis:
View related analysis:
Trump’s 100% Tariff Threat Triggers Global Risk-Off Rout
Trump Reignites Trade War Fears
Appetite for risk shook markets on Friday after President Trump unexpectedly threatened China with an additional 100% tariff on Chinese goods, alongside new export controls on critical U.S. software. The move came in retaliation to Beijing’s restrictions on rare earth exports — key inputs for EV motors, wind turbines, semiconductors, and defense systems worldwide. Given the U.S. sources more than 80% of its rare earths from China, Beijing has clearly struck where it hurts, prompting a swift U.S. response.
Trade Tensions Deepen Amid U.S. Shutdown
With most investors assuming trade wars were dead and buried, this marks a sharp reversal. And with the escalation arriving amid a U.S. government shutdown, the timing couldn’t be worse: key data releases have been suspended or delayed, leaving policymakers flying blind.
From another angle, tariffs are inherently reflationary — yet they’re emerging just as U.S. economic data show signs of fatigue. If consumers pull back spending to weather the storm, it could dampen growth enough to force the Fed into faster rate cuts, even as inflation pressures persist.
Beijing Pushes Back — Carefully
And if you think China is about to blink in response to Trump’s latest tariff threat, think again. Beijing has defended its export restrictions, describing them as legitimate “security measures” rather than acts of retaliation. Officials also stated they will respond to Trump’s tariffs, though history suggests any move will be measured and carefully timed. China is already scrutinising U.S. firms more closely — including an antitrust probe into Qualcomm — raising the odds of non-tariff countermeasures ahead.
Needless to say, this complicates — and potentially threatens — the upcoming U.S.–China summit, as tensions could easily undercut negotiations.


Wall Street Suffers Its Worst Day in Six Months as Volatility Spikes
Wall Street came under immense selling pressure on Friday amid their most bearish day in six months – which incidentally was at the height Trump’s risk-off moves surrounding tariffs.
- Nasdaq 100 futures fell as much as 5% intraday before closing 3.5% lower.
- The Philadelphia Semiconductor Index plunged 6.3%, underscoring how tech and chipmakers bore the brunt of the sell-off.
- S&P 500 futures slid 4% at the session low and ended the day down 2.7%.
- The Dow Jones futures fared slightly better, finishing 2% lower by Friday’s close.
- Renewed fears of a global slowdown saw WTI crude oil fall -5% during its most bearish (and volatile) day since June
- Despite the selloff on Wall Street, gold held its ground around $4000 as the demand for safety overcame the tendency for traders to offload gold to nurse losses on the equity market
- The Japanese yen was the strongest FX major amid risk-off flows, seeing yen crosses toppled in line with my bearish bias outlined last week
Nasdaq 100 Futures (NQ) Daily Chart
Tech traders led the bearish stampede into the close on Friday, with the Nasdaq 100 falling below 25,000 and touching lows near 24,000. After such a sharp reversal from the highs, a quick break to new records looks unlikely — even if Trump walks back his tariff threats.
There are clear signs of weakness in the U.S. economy, and this latest trade spat serves as a reminder of how fragile conditions are — and how complacent traders have become. For now, bears may look to fade rallies, but should keep a close eye on incoming headlines, as volatility cuts both ways — especially when Trump is involved.

Chart analysis by Matt Simpson - data source: TradingView NASDAQ 100 E-mini Futures, S&P 500 E-mini Futures
S&P 500 Futures (ES) Daily Chart
Where the Nasdaq falls, the S&P 500 follows. The key question for traders this week is whether Friday’s volatility spike will prove to be a short-lived event or the start of something more sustained. The current backdrop assumes that rising volatility is bearish for equities — and with October historically the most volatile month of the year for Wall Street, nerves are unlikely to settle quickly.


Gold, WTI Crude Oil Futures Technical Analysis
Gold Futures (GC) Daily Chart:
I noted last week that gold could face some volatility around the $4,000 level, though any pullback was likely to be limited. So far, that’s been the case — gold futures have held steady near $4,000 despite the carnage elsewhere. Normally, gold sells off during periods of Wall Street turmoil as portfolio managers liquidate positions to cover losses. This time, however, safe-haven demand clearly dominated.
The daily trend for gold remains solid, and dips still appear likely to be bought. Even if traders are hesitant to chase prices higher immediately, an eventual sustained move above $4,000 seems more likely than not.
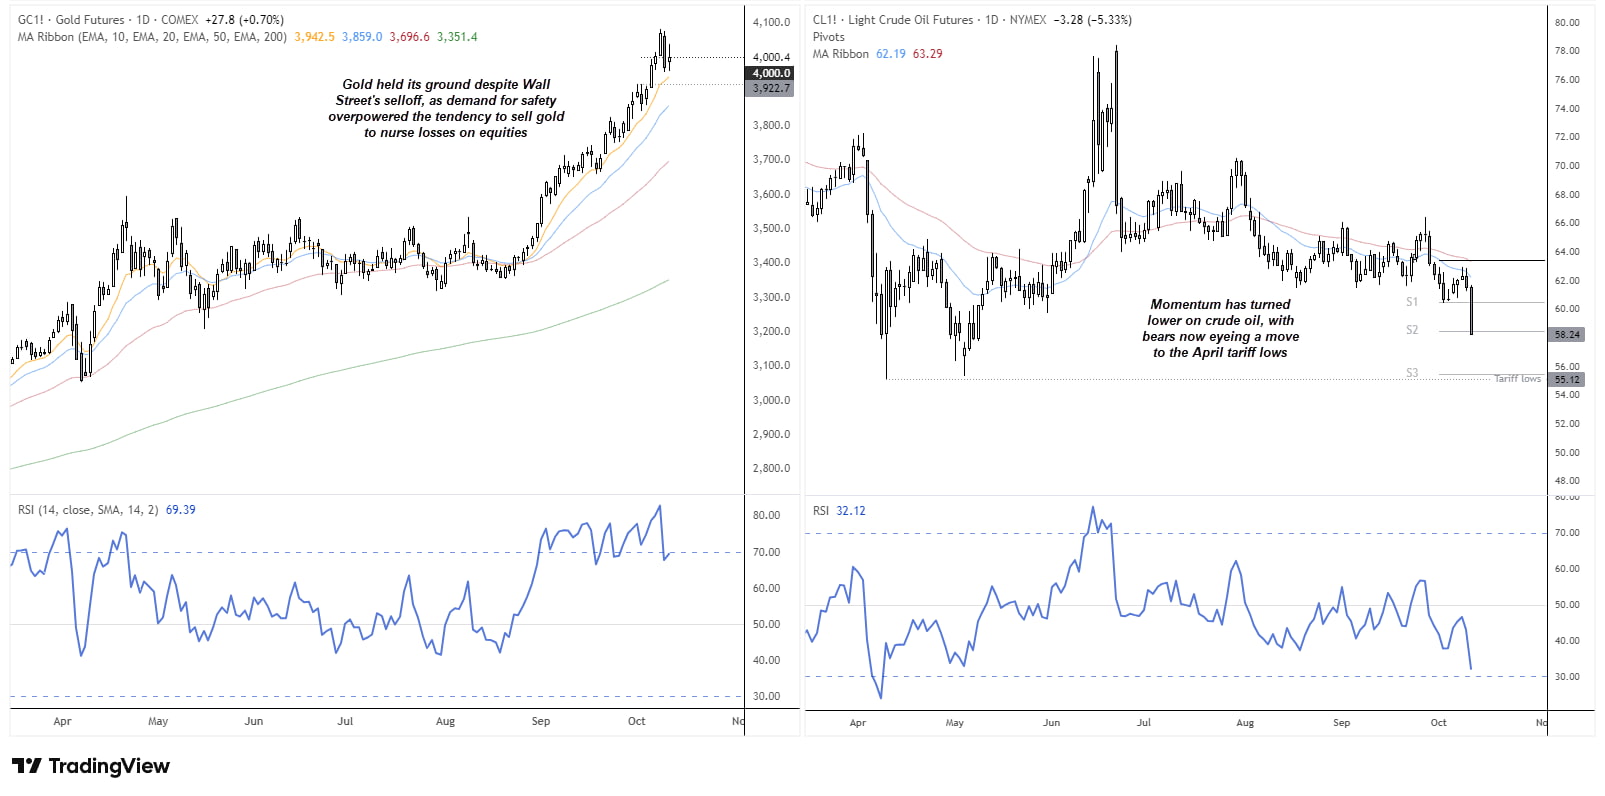
Chart analysis by Matt Simpson, Source: TradingView, COMEX Futures, Gold, ICE Futures, WTI Crude Oil
WTI Crude Oil (CL) Daily Chart:
It was the most bearish day since June for WTI crude oil. Given the bearish structure on the daily chart and revival of bearish momentum, it seems bears now have their eye on a retest of April’s tariff lows just above $55. Note that support was found around the monthly S2 pivot on Friday which could help prices bounce over the nwear term, though bears may seek to fade into moves while prices remain beneath the monthly S1 pivot (60.47) with the monthly S3 pivot $55.45) in focus unless Trump removes the threat of tariffs.
View the full economic calendar
View the full economic calendar
-- Written by Matt Simpson
Follow Matt on Twitter @cLeverEdge
How to trade with City Index
You can trade with City Index by following these four easy steps:
- Open an account, or log in if you’re already a customer
• Open an account in the UK
• Open an account in Australia
• Open an account in Singapore
- Search for the market you want to trade in our award-winning platform
- Choose your position and size, and your stop and limit levels
- Place the trade



Open an account in minutes
Experience award-winning platforms with fast and secure execution, and enjoy tight spreads from 0.5 pts on FX and 0.3 pts on indices.
Economic calendar
Web Trader platform
Our sophisticated web-based platform is packed with features.
Related articles
S&P 500, Nasdaq, Dow Forecast: Nasdaq Selloff Deepens as Dow Rally Stalls 10 24 2026
A failed S&P breakout and looming Nasdaq support test raise the stakes for next week’s Fed decision and October’s monthly close.

Gold Does Something it Hasn’t Done in a Year, is Larger Risk-Off Afoot?
With tech stocks getting hit harder last week there was collateral damage elsewhere, including gold as the metal closed below the $4k level for the week and that’s the first time that’s happened to spot gold in more than a year.


Silver forecast: metals liquidation drags XAG/USD into $50-55 support
Silver has broken its July low and slipped into a long-term support zone as the selling in precious metals deepens. The chart shows where the metal could bottom, and next week's Fed decision may decide whether it does.

This report is intended for general circulation only. It should not be construed as a recommendation, or an offer (or solicitation of an offer) to buy or sell any financial products. The information provided does not take into account your specific investment objectives, financial situation or particular needs. Before you act on any recommendation that may be contained in this report, independent advice ought to be sought from a financial adviser regarding the suitability of the investment product, taking into account your specific investment objectives, financial situation or particular needs.
StoneX Financial Pte. Ltd., may distribute reports produced by its respective foreign entities or affiliates within the StoneX group of companies or third parties pursuant to an arrangement under Regulation 32C of the Financial Advisers Regulations. Where the report is distributed to a person in Singapore who is not an accredited investor, expert investor or an institutional investor (as defined in the Securities Futures Act), StoneX Financial Pte. Ltd. accepts legal responsibility to such persons for the contents of the report only to the extent required by law. Singapore recipients should contact StoneX Financial Pte. Ltd. at 6826 9988 for matters arising from, or in connection with the report.
In the case of all other recipients of this report, to the extent permitted by applicable laws and regulations neither StoneX Financial Pte. Ltd. nor its associated companies will be responsible or liable for any loss or damage incurred arising out of, or in connection with, any use of the information contained in this report and all such liability is hereby expressly disclaimed. No representation or warranty is made, express or implied, that the content of this report is complete or accurate.
StoneX Financial Pte. Ltd. is not under any obligation to update this report.
Trading CFDs carries a high level of risk that may not be suitable for some investors. Consider your investment objectives, level of experience, financial resources, risk appetite and other relevant circumstances carefully. The possibility exists that you could lose some or all of your investments, including your initial deposits. If in doubt, please seek independent expert advice. Visit www.forex.com/en-sg/terms-and-policies for the complete Risk Disclosure Statement.