



Gold Volatility Perks Up At $4k, Though Pullbacks Could Be Limited
Gold’s meteoric rise above $4,000 has drawn traders’ attention, with volatility picking up sharply at record highs. Yet with sentiment and positioning still far from extreme, any correction could prove shallow as dip buyers re-emerge.
Share this:

Gold’s meteoric rise to $4,000 has been well documented, but volatility has finally returned near the highs — which could leave some traders hesitant to rejoin the trend immediately. That could translate into choppy price action around current levels before gold either retraces or resumes its advance.
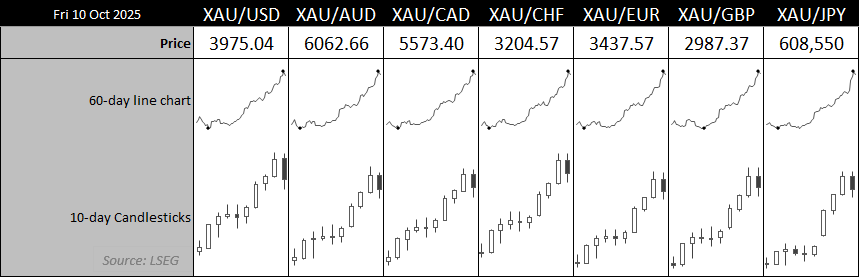
Chart analysis by Matt Simpson - Source: LSEG
View related analysis:
View related analysis:
Gold’s 60-day line charts against FX majors highlight how relentless the rally has been, with barely a pause or pullback on the daily timeframe. However, Thursday’s futures session against the US dollar stood out as the most volatile day in five months — and notably, the highest volume day in six — suggesting initiative selling rather than simple long liquidation. Moreover, with gold failing to close within its upper Keltner band for the past month, the case for a proper mean-reversion phase is strengthening.
Still, gold produced little in the way of a pullback after breaking above $3,000 for the first time in history back in January. It recorded only a single daily close below that level before the uptrend resumed, even staging a brief retest before bulls regained control. Unless momentum turns sharply lower, gold may remain vulnerable to dip buyers — or even see an extension of its rally.

Chart analysis by Matt Simpson - Source: COMEX, LSEG


Gold Futures Positioning (GC): Weekly COT Report Analysis
Futures traders are not positioned at a sentiment extreme on gold. While both large speculators and managed funds have steadily increased their net-long exposure since May, the pace has been measured — and positioning remains well below the extremes seen at previous price peaks. Gross shorts have ticked higher but remain relatively low, while gross longs have not reached levels that typically signal overcrowding.
Overall, market positioning remains supportive of gold prices, suggesting that any pullbacks could be shallow and continue to attract dip buyers.

Chart analysis by Matt Simpson – Source: COMEX, LSEG
Gold Futures (GC) Technical Analysis: 1-Hour Chart
Prices are a touch above $4k at the time of writing as it retraces some of Thursday’s selloff during thin Asian trade today. But I am inclined to suspect the near term top is in place and that bears could fade into moves towards Thursday’s high/ Note that the monthly R1 pivot is just above $4k which could help cap gains or help form a swing high in the area.
Should bears get their way, gold could retrace to the 10-day EMA (3930) or weekly VPOC at 3892. Should bearish momentum increase then a move to 3800 could be on the cards, just above the prior weekly VPOC and monthly pivot point. But as outlined above, I suspect the retracement could be limited, so these lower targets are not currently favoured unless we see a material change in sentiment against gold.
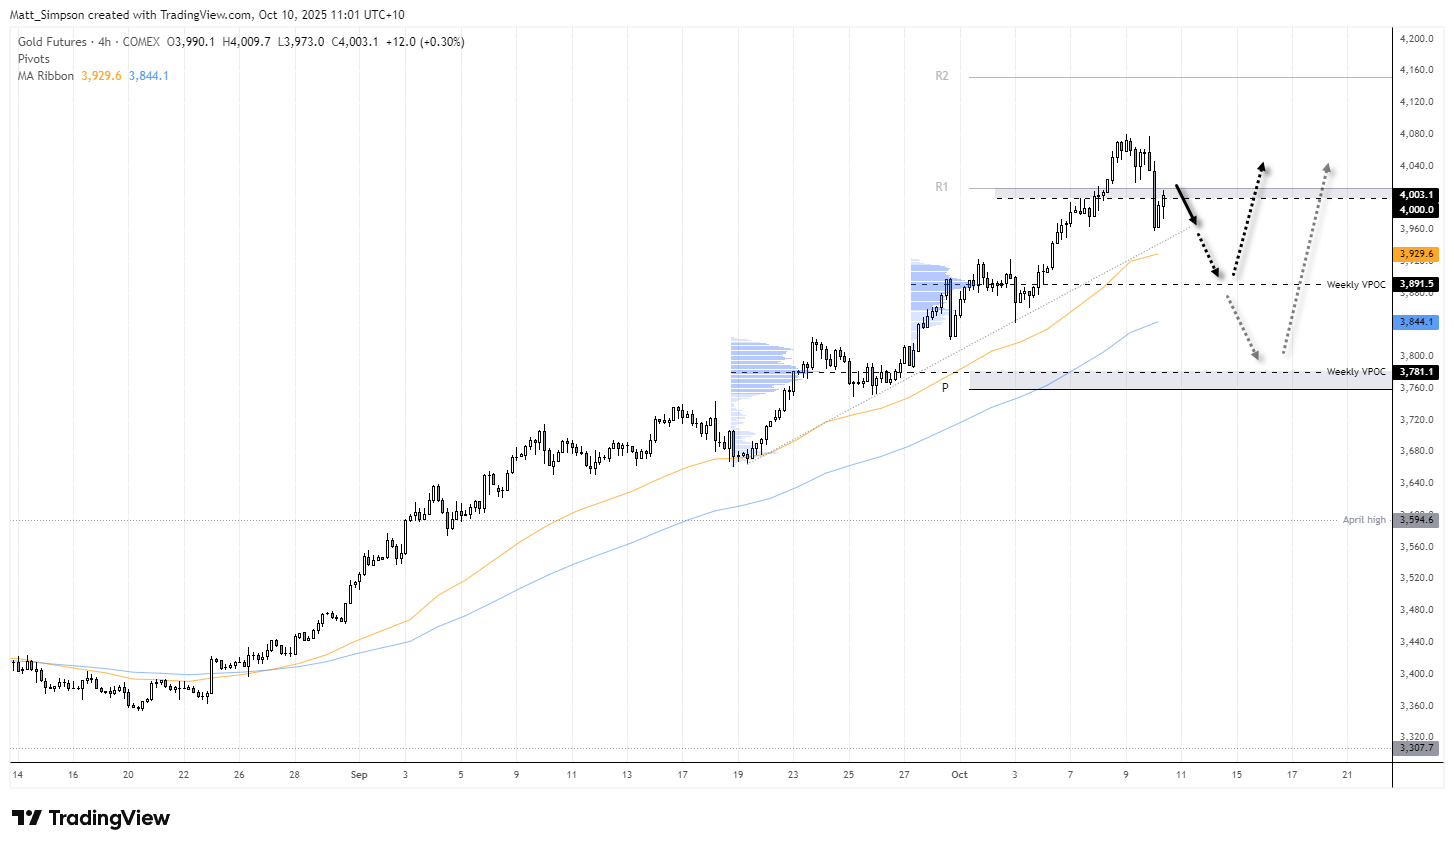
Chart analysis by Matt Simpson – Source: COMEX, LSEG
View the full economic calendar
View the full economic calendar
-- Written by Matt Simpson
Follow Matt on Twitter @cLeverEdge
How to trade with City Index
You can trade with City Index by following these four easy steps:
- Open an account, or log in if you’re already a customer
• Open an account in the UK
• Open an account in Australia
• Open an account in Singapore
- Search for the market you want to trade in our award-winning platform
- Choose your position and size, and your stop and limit levels
- Place the trade
Related tags:



Open an account in minutes
Experience award-winning platforms with fast and secure execution, and enjoy tight spreads from 0.5 pts on FX and 0.3 pts on indices.
Economic calendar
Web Trader platform
Our sophisticated web-based platform is packed with features.
Related articles

Gold Does Something it Hasn’t Done in a Year, is Larger Risk-Off Afoot?
With tech stocks getting hit harder last week there was collateral damage elsewhere, including gold as the metal closed below the $4k level for the week and that’s the first time that’s happened to spot gold in more than a year.


Silver forecast: metals liquidation drags XAG/USD into $50-55 support
Silver has broken its July low and slipped into a long-term support zone as the selling in precious metals deepens. The chart shows where the metal could bottom, and next week's Fed decision may decide whether it does.


Silver Forecast: XAG/USD Hits Fresh 2026 Lows as Selling Pressure Accelerates
Trading conditions continue to be challenging for silver in the short term. The precious metal has been losing value at an accelerated pace and, during today's session alone, has fallen more than 5.5%, reaching new lows for 2026. This development highlights how selling pressure has become increasingly dominant across recent market activity.

This report is intended for general circulation only. It should not be construed as a recommendation, or an offer (or solicitation of an offer) to buy or sell any financial products. The information provided does not take into account your specific investment objectives, financial situation or particular needs. Before you act on any recommendation that may be contained in this report, independent advice ought to be sought from a financial adviser regarding the suitability of the investment product, taking into account your specific investment objectives, financial situation or particular needs.
StoneX Financial Pte. Ltd., may distribute reports produced by its respective foreign entities or affiliates within the StoneX group of companies or third parties pursuant to an arrangement under Regulation 32C of the Financial Advisers Regulations. Where the report is distributed to a person in Singapore who is not an accredited investor, expert investor or an institutional investor (as defined in the Securities Futures Act), StoneX Financial Pte. Ltd. accepts legal responsibility to such persons for the contents of the report only to the extent required by law. Singapore recipients should contact StoneX Financial Pte. Ltd. at 6826 9988 for matters arising from, or in connection with the report.
In the case of all other recipients of this report, to the extent permitted by applicable laws and regulations neither StoneX Financial Pte. Ltd. nor its associated companies will be responsible or liable for any loss or damage incurred arising out of, or in connection with, any use of the information contained in this report and all such liability is hereby expressly disclaimed. No representation or warranty is made, express or implied, that the content of this report is complete or accurate.
StoneX Financial Pte. Ltd. is not under any obligation to update this report.
Trading CFDs carries a high level of risk that may not be suitable for some investors. Consider your investment objectives, level of experience, financial resources, risk appetite and other relevant circumstances carefully. The possibility exists that you could lose some or all of your investments, including your initial deposits. If in doubt, please seek independent expert advice. Visit www.forex.com/en-sg/terms-and-policies for the complete Risk Disclosure Statement.