



Gold Outlook: Rising Implied Volatility on Path to $4000
Gold eyes $4,000 as implied volatility climbs, COT positioning strengthens, and technical signals confirm bullish momentum.
Share this:

Gold futures are charging toward the $4,000 milestone, backed by firm bullish positioning, rising implied volatility, and strong technical momentum. While sentiment remains supportive, traders are also hedging with downside protection, hinting at heightened swings as prices press higher. With positioning, volatility, and technicals aligning, gold’s rally remains intact — but traders should be alert for shakeouts as $4,000 comes into view.
View related analysis:
View related analysis:
Gold Outlook: Positioning, Volatility, and Technicals in Focus
Gold Futures Positioning (GC): Weekly COT Report Analysis
Market positioning in gold futures remains notable as traders show no signs of reaching a sentiment extreme despite surging prices. The latest Commitment of Traders (COT) report reveals that net-long exposure is trending higher among large speculators and managed funds, though still not at historically stretched levels. Gross-longs continue to climb while shorts remain relatively low, although there has been a slight uptick in gross-short exposure in recent weeks.
With the trend firmly higher and net-long positioning gradually increasing, $4,000 appears to be the next logical upside target. Dip buyers are likely to remain active, stepping in to capitalise on pullbacks.
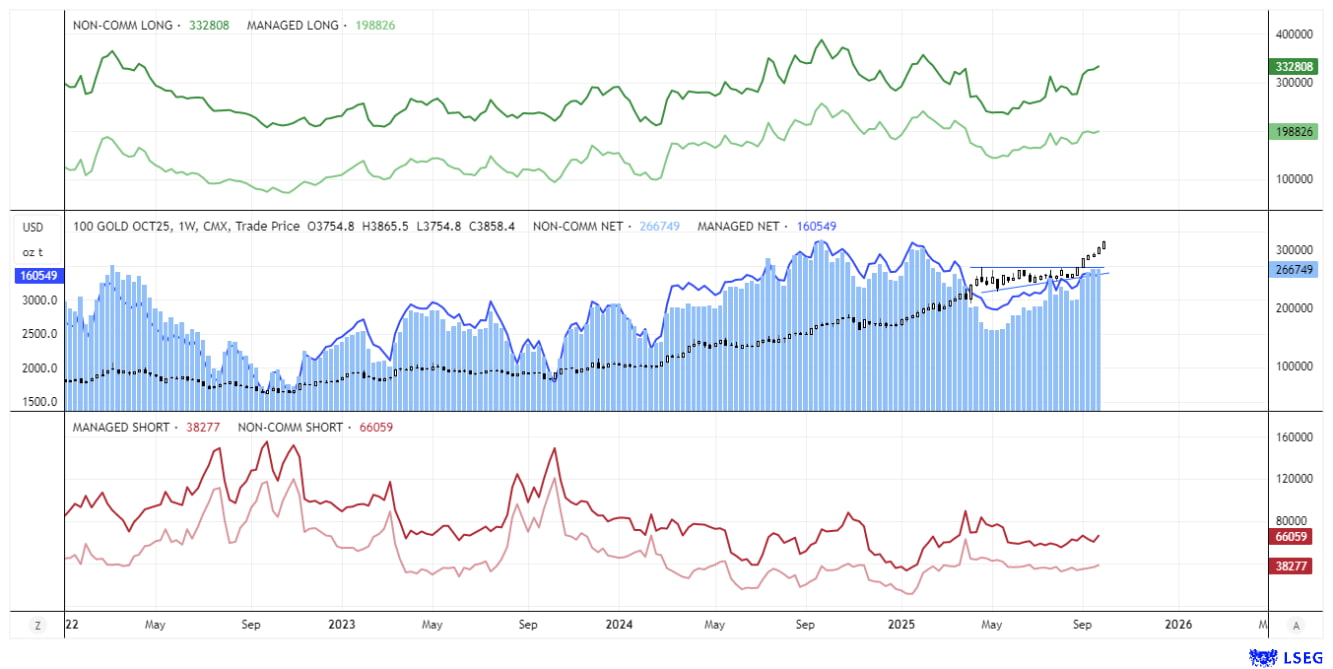
Chart analysis by Matt Simpson, Source: COMEX Futures, LSEG


Gold Implied Volatility and Risk Reversals
Gold’s implied volatility has climbed in recent weeks, with 1-month annualised IV hitting a three-month high of 17.3 on Friday, while 1-week IV rose to a two-week high at 16.04. This suggests traders may be preparing for further price swings as gold approaches the key $4,000 level.
At the same time, risk-reversals have tilted lower, signalling increased demand for puts relative to calls – a sign that traders are hedging against downside risks despite the strong bullish trend.

Chart analysis by Matt Simpson, Source: COMEX Futures, LSEG
Gold Futures (GC) Technical Analysis
The daily chart shows gold tracking along the 10-day EMA and now trading just over $100 below the $4,000 milestone. The RSI (14) is firmly in overbought territory – exactly where it should be during such a strong rally. Even so, a long-legged doji formed yesterday, hinting at some hesitation to push higher.
On Tuesday, gold saw a sharp selloff around the European open, with rising volumes suggesting bearish initiation. However, buying pressure quickly regained control during the US session, and prices have since pushed to fresh highs in Asia. The cumulative volume delta (CVD) has also reached new highs, confirming strong demand.
The takeaway is that buyers remain eager to step in on even minor dips. While gold bulls appear determined to test $4,000, traders should brace for heightened volatility as that level nears – and the potential for a shakeout if prices tag the milestone.

Chart analysis by Matt Simpson, Source: TradingView, COMEX Futures, Gold
View the full economic calendar
View the full economic calendar
-- Written by Matt Simpson
Follow Matt on Twitter @cLeverEdge
How to trade with City Index
You can trade with City Index by following these four easy steps:
- Open an account, or log in if you’re already a customer
• Open an account in the UK
• Open an account in Australia
• Open an account in Singapore
- Search for the market you want to trade in our award-winning platform
- Choose your position and size, and your stop and limit levels
- Place the trade
Related tags:



Open an account in minutes
Experience award-winning platforms with fast and secure execution, and enjoy tight spreads from 0.5 pts on FX and 0.3 pts on indices.
Economic calendar
Web Trader platform
Our sophisticated web-based platform is packed with features.
Related articles

Gold Does Something it Hasn’t Done in a Year, is Larger Risk-Off Afoot?
With tech stocks getting hit harder last week there was collateral damage elsewhere, including gold as the metal closed below the $4k level for the week and that’s the first time that’s happened to spot gold in more than a year.


Silver forecast: metals liquidation drags XAG/USD into $50-55 support
Silver has broken its July low and slipped into a long-term support zone as the selling in precious metals deepens. The chart shows where the metal could bottom, and next week's Fed decision may decide whether it does.


Silver Forecast: XAG/USD Hits Fresh 2026 Lows as Selling Pressure Accelerates
Trading conditions continue to be challenging for silver in the short term. The precious metal has been losing value at an accelerated pace and, during today's session alone, has fallen more than 5.5%, reaching new lows for 2026. This development highlights how selling pressure has become increasingly dominant across recent market activity.

This report is intended for general circulation only. It should not be construed as a recommendation, or an offer (or solicitation of an offer) to buy or sell any financial products. The information provided does not take into account your specific investment objectives, financial situation or particular needs. Before you act on any recommendation that may be contained in this report, independent advice ought to be sought from a financial adviser regarding the suitability of the investment product, taking into account your specific investment objectives, financial situation or particular needs.
StoneX Financial Pte. Ltd., may distribute reports produced by its respective foreign entities or affiliates within the StoneX group of companies or third parties pursuant to an arrangement under Regulation 32C of the Financial Advisers Regulations. Where the report is distributed to a person in Singapore who is not an accredited investor, expert investor or an institutional investor (as defined in the Securities Futures Act), StoneX Financial Pte. Ltd. accepts legal responsibility to such persons for the contents of the report only to the extent required by law. Singapore recipients should contact StoneX Financial Pte. Ltd. at 6826 9988 for matters arising from, or in connection with the report.
In the case of all other recipients of this report, to the extent permitted by applicable laws and regulations neither StoneX Financial Pte. Ltd. nor its associated companies will be responsible or liable for any loss or damage incurred arising out of, or in connection with, any use of the information contained in this report and all such liability is hereby expressly disclaimed. No representation or warranty is made, express or implied, that the content of this report is complete or accurate.
StoneX Financial Pte. Ltd. is not under any obligation to update this report.
Trading CFDs carries a high level of risk that may not be suitable for some investors. Consider your investment objectives, level of experience, financial resources, risk appetite and other relevant circumstances carefully. The possibility exists that you could lose some or all of your investments, including your initial deposits. If in doubt, please seek independent expert advice. Visit www.forex.com/en-sg/terms-and-policies for the complete Risk Disclosure Statement.