







Crude Oil Forecast: Will the 2021 Support Hold Amid Global Shifts?
Crude Oil Forecast: The December 2021 support level remains a key factor amid shifting data on US inventories, Middle East conflicts and ceasefire hopes, economic indicators, and supply quotas. Will it hold through 2024?
Share this:

Key Events
- Chinese Manufacturing PMIs: Chinese PMIs rose above the expansionary 50 mark for the first time since April 2024, providing some optimism but with additional data needed to improve the crude demand outlook from China’s economy.
- ADP Non-Farm Payrolls: The latest ADP report showed a positive change of 233k, the highest increase since August 2023. Friday’s non-farm payroll data is anticipated to further shape monetary policy expectations and its effects on various markets, including oil.
- Middle East Negotiations: Talks continue ahead of the US elections, but no resolutions have been reached yet, keeping supply risks elevated.
- Impact of US Elections
Where is the 2021 Support?
Source: Tradingview
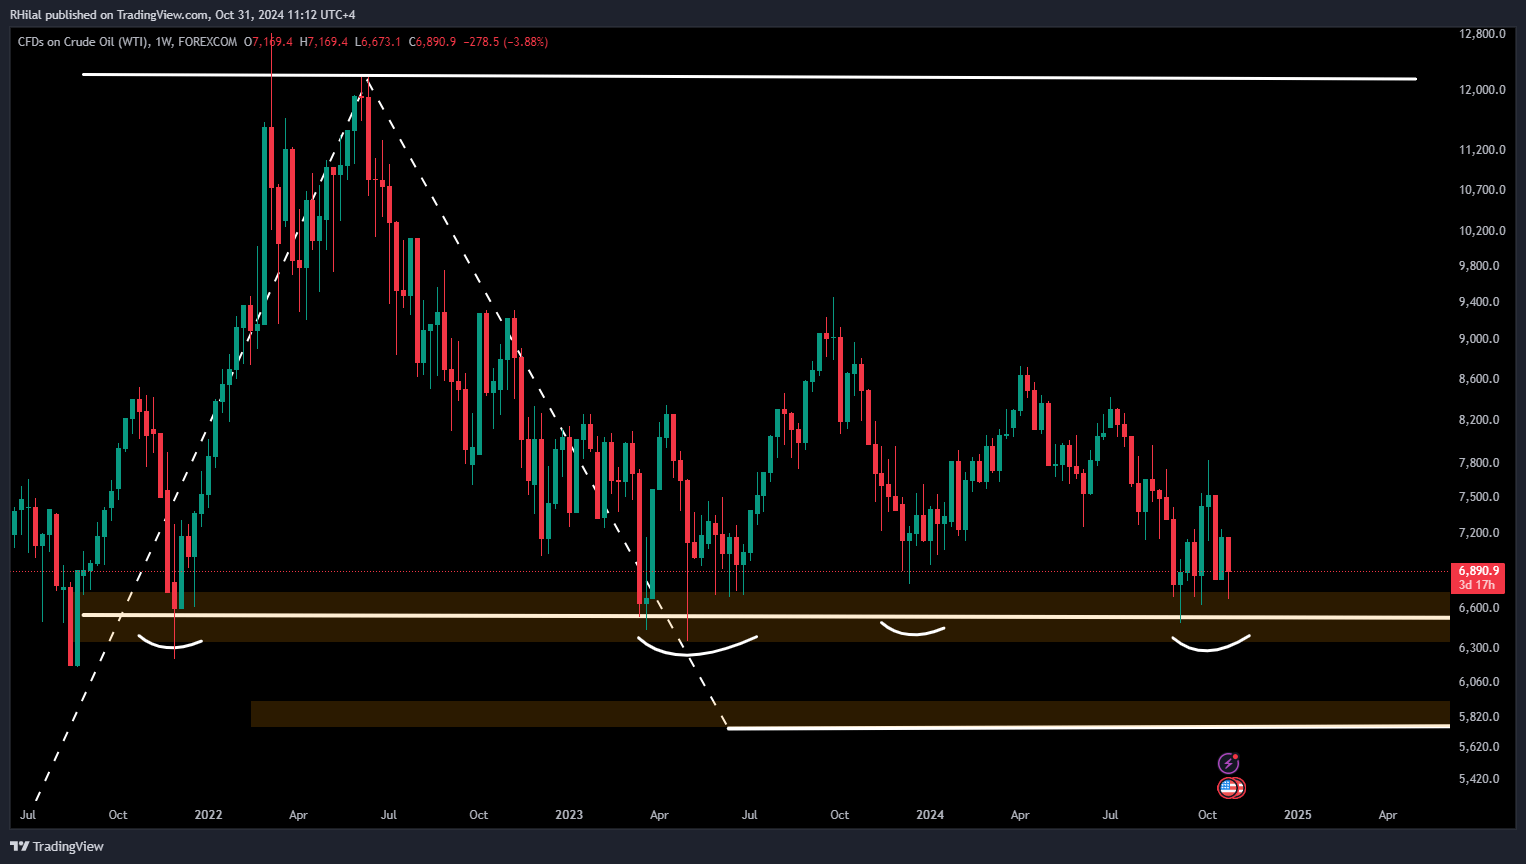
The lows recorded in December 2021, covering the 67-64 price range, have established a crucial support level that has held through 2023’s lows in March to June, as well as in December 2023 and September-October 2024.
This support zone has aligned with significant market events over nearly three years and is expected to maintain its volatile, supportive effect on oil prices until a confirmed close below the 64-mark occurs. Such a break could intensify bearish scenarios, particularly as global shifts toward renewable energy progress.
Crude Oil Forecast: 3-Day Time Frame – Log Scale
Source: Tradingview
Oil prices recently rebounded from the critical support zone at 66.70, rising back to 69. Volatility within the 64-67 zone is likely to continue until a decisive breakout or reversal takes place.
The RSI indicator’s recent rebound from oversold levels has formed a possible head-and-shoulders pattern below the neutral zone, with the breakout target aligning with the oversold threshold. If this head-and-shoulders pattern breaks below the 64-mark, the next support is anticipated around the 60-58 range.
On the upside, resistance is likely at levels 70 and 72 before any potential move toward the 75-76 range, which would align with the 50-period simple moving average.
— Written by Razan Hilal, CMT – on X: @Rh_waves
Key Events
- Chinese Manufacturing PMIs: Chinese PMIs rose above the expansionary 50 mark for the first time since April 2024, providing some optimism but with additional data needed to improve the crude demand outlook from China’s economy.
- ADP Non-Farm Payrolls: The latest ADP report showed a positive change of 233k, the highest increase since August 2023. Friday’s non-farm payroll data is anticipated to further shape monetary policy expectations and its effects on various markets, including oil.
- Middle East Negotiations: Talks continue ahead of the US elections, but no resolutions have been reached yet, keeping supply risks elevated.
- Impact of US Elections
Where is the 2021 Support?
Source: Tradingview
The lows recorded in December 2021, covering the 67-64 price range, have established a crucial support level that has held through 2023’s lows in March to June, as well as in December 2023 and September-October 2024.
This image will only appear on cityindex websites!
This image will only appear on forex websites!
This support zone has aligned with significant market events over nearly three years and is expected to maintain its volatile, supportive effect on oil prices until a confirmed close below the 64-mark occurs. Such a break could intensify bearish scenarios, particularly as global shifts toward renewable energy progress.
Crude Oil Forecast: 3-Day Time Frame – Log Scale
Source: Tradingview
Oil prices recently rebounded from the critical support zone at 66.70, rising back to 69. Volatility within the 64-67 zone is likely to continue until a decisive breakout or reversal takes place.
The RSI indicator’s recent rebound from oversold levels has formed a possible head-and-shoulders pattern below the neutral zone, with the breakout target aligning with the oversold threshold. If this head-and-shoulders pattern breaks below the 64-mark, the next support is anticipated around the 60-58 range.
On the upside, resistance is likely at levels 70 and 72 before any potential move toward the 75-76 range, which would align with the 50-period simple moving average.
— Written by Razan Hilal, CMT – on X: @Rh_waves
Related tags:




Open an account in minutes
Experience award-winning platforms with fast and secure execution, and enjoy tight spreads from 0.5 pts on FX and 0.3 pts on indices.
Economic calendar
Web Trader platform
Our sophisticated web-based platform is packed with features.
Related articles

Dow Jones Forecast: DJIA rises after weaker jobs data
U.S. stocks are rising after weaker-than-expected U.S. jobs data saw markets rein in rate hike expectations.


Nasdaq 100 Forecast: NDX slips as Treasury yields keep rising
U.S. stocks are falling at the start of Q4, as gains in software stocks offset concerns over soaring Treasury yields. U.S. Treasury yields continue to rise, with the 10-year yield up 2 basis points at 5.31% and the 30-year at 5.66%, multi-decade highs.

S&P 500 Forecast: SPX rises after cooler-than-expected inflation data
U.S. stocks are rising and Treasury yields are falling after data showed that inflation increased at a cooler pace than expected, while U.S. consumer spending rose again in August.
This report is intended for general circulation only. It should not be construed as a recommendation, or an offer (or solicitation of an offer) to buy or sell any financial products. The information provided does not take into account your specific investment objectives, financial situation or particular needs. Before you act on any recommendation that may be contained in this report, independent advice ought to be sought from a financial adviser regarding the suitability of the investment product, taking into account your specific investment objectives, financial situation or particular needs.
StoneX Financial Pte. Ltd., may distribute reports produced by its respective foreign entities or affiliates within the StoneX group of companies or third parties pursuant to an arrangement under Regulation 32C of the Financial Advisers Regulations. Where the report is distributed to a person in Singapore who is not an accredited investor, expert investor or an institutional investor (as defined in the Securities Futures Act), StoneX Financial Pte. Ltd. accepts legal responsibility to such persons for the contents of the report only to the extent required by law. Singapore recipients should contact StoneX Financial Pte. Ltd. at 6826 9988 for matters arising from, or in connection with the report.
In the case of all other recipients of this report, to the extent permitted by applicable laws and regulations neither StoneX Financial Pte. Ltd. nor its associated companies will be responsible or liable for any loss or damage incurred arising out of, or in connection with, any use of the information contained in this report and all such liability is hereby expressly disclaimed. No representation or warranty is made, express or implied, that the content of this report is complete or accurate.
StoneX Financial Pte. Ltd. is not under any obligation to update this report.
Trading CFDs carries a high level of risk that may not be suitable for some investors. Consider your investment objectives, level of experience, financial resources, risk appetite and other relevant circumstances carefully. The possibility exists that you could lose some or all of your investments, including your initial deposits. If in doubt, please seek independent expert advice. Visit www.forex.com/en-sg/terms-and-policies for the complete Risk Disclosure Statement.