



Crude Oil Weekly Outlook: WTI Risks Pullback as US-Iran Deal Nears Completion
WTI crude oil faces rising drawdown risks as US-Iran negotiations advance, raising expectations for resumed Strait of Hormuz flows and easing geopolitical tensions. Key technical levels, OPEC+ supply, and inflation risks in focus.
Share this:

WTI crude oil risks a deeper pullback as negotiations between the United States and Iran appear to be advancing, raising expectations for a potential reopening of the Strait of Hormuz and renewed Iranian oil exports. Market speculation around easing geopolitical tensions has already pressured prices lower, although the outcome remains uncertain and not fully priced into markets yet.
An extended consolidation phase has dominated crude oil price action since March 2026, with breakout risks building as traders await confirmation on the next major geopolitical and macroeconomic catalyst.
Key factors currently driving the crude oil outlook include:
- Potential lifting of Iranian oil sanctions
- OPEC+ production increases, including 206,000 bpd in May and an additional 188,000 bpd expected in June
- Possible resumption of flows through the Strait of Hormuz, which normally handles nearly 20% of global oil supply, equivalent to roughly 14 million barrels per day
- Inventory fluctuations following historic drawdowns heading into the summer demand season, as the IEA continues to warn about record inventory depletion
- The possibility of prolonged negotiations keeping supply normalization delayed
- Additional time potentially needed to fully restore shipping activity and pricing stability across the Strait of Hormuz even after any formal agreement is signed
Contracting Triangle and Diamond Reversal Risks Build in Crude Oil
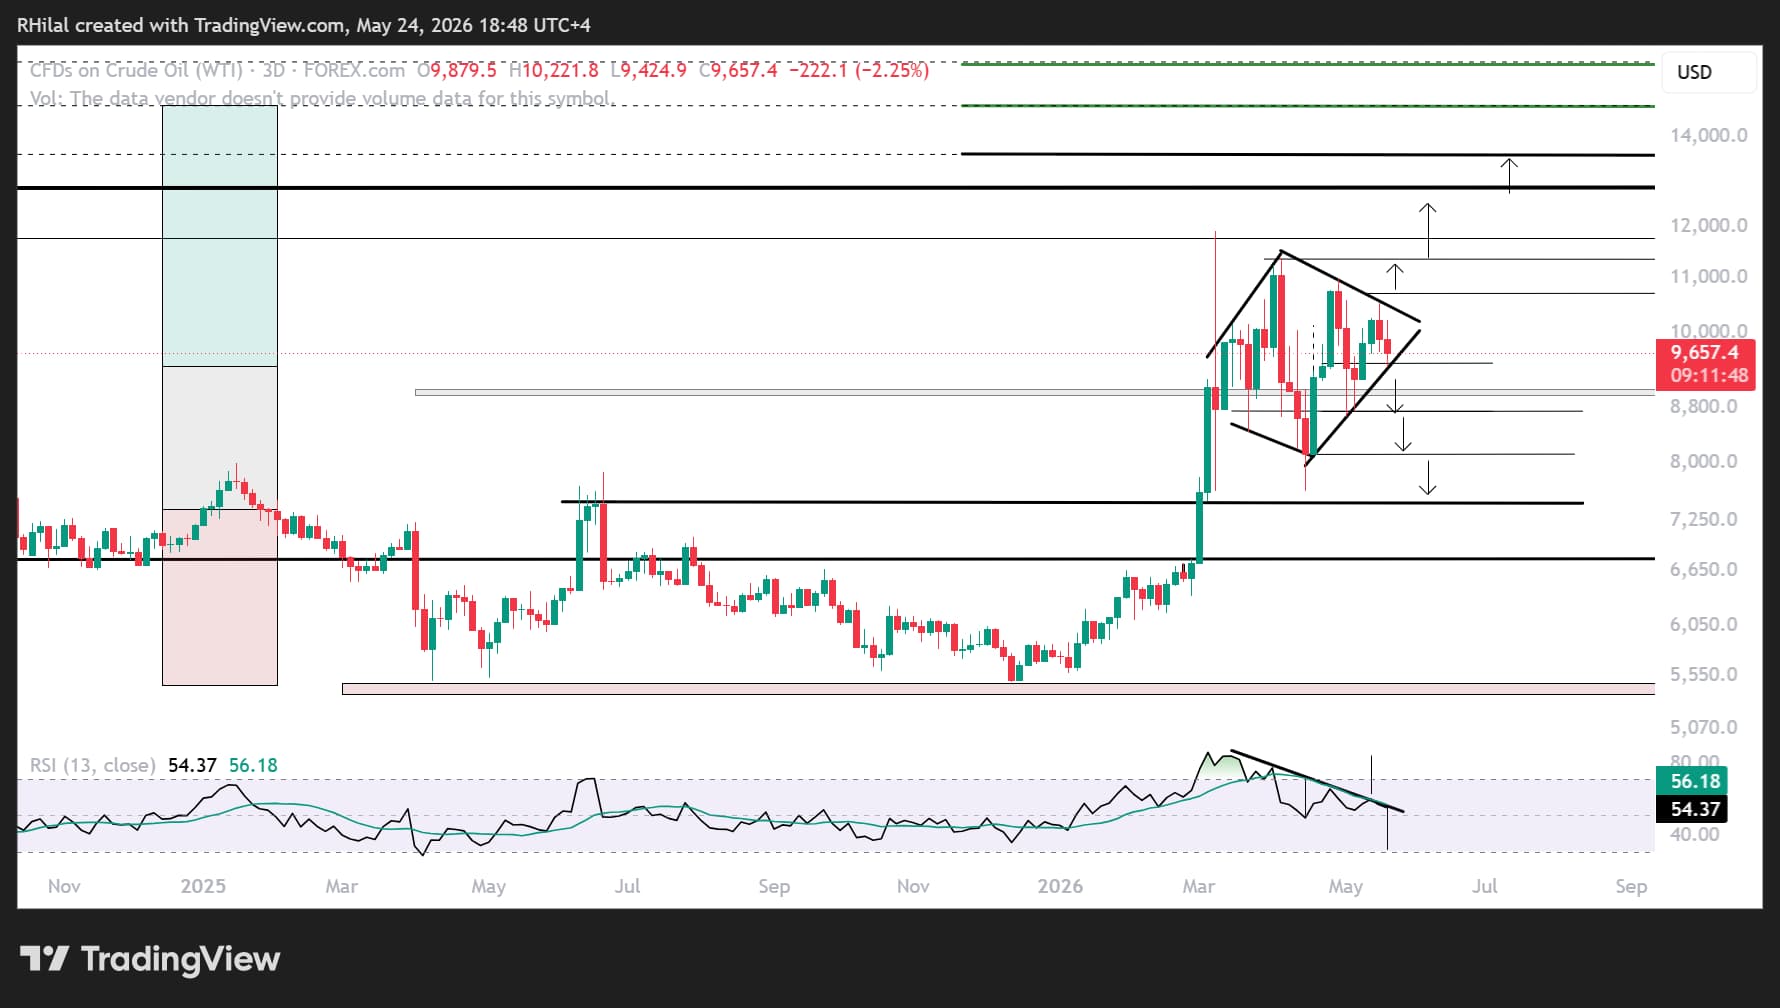
This consolidation phase is increasingly taking the form of a contracting triangle and potentially a broader diamond reversal structure, reflecting growing uncertainty and compression in volatility before the next directional move. These patterns are outlined in the charts below.
Bitcoin and Equity Markets Reflect Cautious Risk Optimism
As major traditional markets remained closed over the weekend, Bitcoin reflected improving risk sentiment by extending gains toward the 77,000 region, while still trading below the midpoint of the broader ascending channel from the yearly lows. This continued to reflect cautious optimism across global markets after the Dow Jones closed at fresh record highs above 50,500, while the Nasdaq and S&P 500 remained relatively softer.
WTI Crude Oil Consolidation Tightens Near the $94 Region
In crude oil specifically, the consolidation since March 2026 appears to be tightening near the psychologically important $94 region, increasing the risk of a sharp breakout as traders position early for the next major move.
Crude Oil Weekly Outlook: 3-Day Time Frame – Log Scale
Source: TradingView
Crude oil price action continues to hold within the broader multi-month consolidation near the $94 region, while challenging the descending resistance trendline connecting the lower highs since March 2026.
This keeps bullish breakout risks in focus should prices regain sustained momentum above the 108 barrier, potentially reviving inflationary pressures across global markets while weighing further on bonds and limiting gains across risk assets, including precious metals, as mentioned in my latest video Dollar Strength Hurt Gold and Silver?.
The inflationary environment is not driven solely by crude oil. Fertilizers, shipping costs, and broader supply chain disruptions continue to contribute to inflation pressures globally. However, crude oil remains one of the clearest real-time indicators of Middle East geopolitical risk, keeping several key intermarket scenarios in focus.
Bullish Scenario for Crude Oil
A sustained breakout above 108 and 115 could expose another major upside leg later this year toward 126, 135, and potentially 157.
These levels align with the Fibonacci extension ratios of 61.8%, 78.6%, and 100% of the broader 2020–2022–2026 cycle, near 126,135, and 157 respectively.
Such a scenario would likely add renewed pressure on global currencies against the US dollar, support commodity-linked inflation trends, and potentially weigh on broader risk sentiment outside the AI-driven equity momentum theme.
Technically, the bullish scenario would align with both RSI and price action breaking above the descending trendline connecting the lower highs since March 2026, opening the door for one final extended rally phase.
Bearish Scenario for Crude Oil
A sustained hold below the 2023 highs near the 88–91 barrier would reinforce the de-escalation narrative and expose prices toward 86, 82, and 79 before potentially retesting the previous Middle East conflict breakout zone near 76.
A deeper bearish continuation could eventually expose the 67 region if geopolitical risk premiums continue fading, the target of a potential diamond reversal pattern in play.
The bearish scenario would likely align with continued RSI weakness, with lower highs persisting since March 2026 and momentum remaining below the neutral 50 barrier. This would confirm the risk of a diagonal pattern breakdown similar in magnitude to the aggressive breakout that preceded the current formation.
Such a move would likely ease inflationary pressures across global markets and potentially allow risk assets to stabilize further should central banks gradually shift toward less hawkish policy expectations.
Written by Razan Hilal, CMT
Follow on X: @Rh_waves




Open an account in minutes
Experience award-winning platforms with fast and secure execution, and enjoy tight spreads from 0.5 pts on FX and 0.3 pts on indices.
Economic calendar
Web Trader platform
Our sophisticated web-based platform is packed with features.
Related articles
USD/JPY weekly outlook: Quarter turn scrambles rates regime
USD/JPY’s tight relationship with front-end US rates broke down sharply last week, but quarter-turn flows and positioning suggest the disconnect may prove temporary.

Dow Jones Forecast: DJIA rises after weaker jobs data
U.S. stocks are rising after weaker-than-expected U.S. jobs data saw markets rein in rate hike expectations.


What Stretched 10-Year Yields Mean for Major Currency Pairs in Q4
U.S. 10-year Treasury yields are nearing a long-term resistance zone with overbought RSI readings, raising near-term pullback risk for the dollar.
This report is intended for general circulation only. It should not be construed as a recommendation, or an offer (or solicitation of an offer) to buy or sell any financial products. The information provided does not take into account your specific investment objectives, financial situation or particular needs. Before you act on any recommendation that may be contained in this report, independent advice ought to be sought from a financial adviser regarding the suitability of the investment product, taking into account your specific investment objectives, financial situation or particular needs.
StoneX Financial Pte. Ltd., may distribute reports produced by its respective foreign entities or affiliates within the StoneX group of companies or third parties pursuant to an arrangement under Regulation 32C of the Financial Advisers Regulations. Where the report is distributed to a person in Singapore who is not an accredited investor, expert investor or an institutional investor (as defined in the Securities Futures Act), StoneX Financial Pte. Ltd. accepts legal responsibility to such persons for the contents of the report only to the extent required by law. Singapore recipients should contact StoneX Financial Pte. Ltd. at 6826 9988 for matters arising from, or in connection with the report.
In the case of all other recipients of this report, to the extent permitted by applicable laws and regulations neither StoneX Financial Pte. Ltd. nor its associated companies will be responsible or liable for any loss or damage incurred arising out of, or in connection with, any use of the information contained in this report and all such liability is hereby expressly disclaimed. No representation or warranty is made, express or implied, that the content of this report is complete or accurate.
StoneX Financial Pte. Ltd. is not under any obligation to update this report.
Trading CFDs carries a high level of risk that may not be suitable for some investors. Consider your investment objectives, level of experience, financial resources, risk appetite and other relevant circumstances carefully. The possibility exists that you could lose some or all of your investments, including your initial deposits. If in doubt, please seek independent expert advice. Visit www.forex.com/en-sg/terms-and-policies for the complete Risk Disclosure Statement.