


Dow Jones Analysis: DJIA loses ground and moves away from 50,000 points
The week has started in negative territory for the Dow Jones index, with today’s session showing a decline of more than 1.3%, as confidence once again begins to fade. Selling pressure has stabilized in recent sessions amid rising global tariff tensions.
Share this:

The week has started in negative territory for the Dow Jones index, with today’s session showing a decline of more than 1.3%, as confidence once again begins to fade. Selling pressure has stabilized in recent sessions amid rising global tariff tensions, reigniting the debate over a potentially more aggressive central bank stance and reducing short-term appetite for risk assets. If this environment persists, a more dominant bearish pressure could consolidate in the coming trading sessions.


Tariff situation affects expectations
Last week, the United States Supreme Court announced the suspension of the tariffs proposed by the Trump administration, arguing that they could not be imposed without Congressional approval. In response, the administration stated it would implement a 15% global tariff on imports entering the country. Several trading partners reacted negatively, arguing that the measure disrupts the current balance of trade relations.
Beyond the immediate impact, the possibility of a renewed trade war has begun to shift the Dow Jones outlook toward a more negative short-term bias. Among the index’s main components, Goldman Sachs is down -3.69%, Caterpillar falls -0.4%, Microsoft declines -2.62%, and Home Depot loses -1.42%, while Amgen gains +1.5%. This is particularly relevant considering these five companies account for more than 30% of the index’s weight, reflecting a meaningful capital outflow from its most influential components.
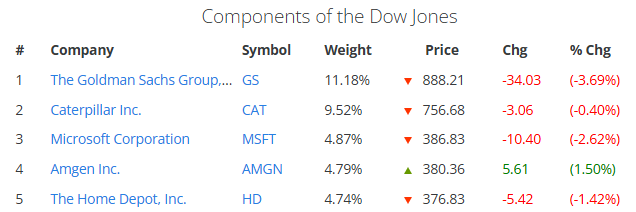
Source: Slickcharts
The impact extends beyond sentiment. A broad 15% tariff could raise import costs and generate additional inflationary pressures, complicating the outlook for a Federal Reserve operating with lower rates. The market currently assigns a 96% probability that rates will remain unchanged in March, 82.1% in April, and for June the probability of a rate cut (46.8%) now closely competes with the probability of holding rates steady (44.7%). This suggests that the path toward a more flexible monetary policy is no longer as clear as it appeared weeks ago.
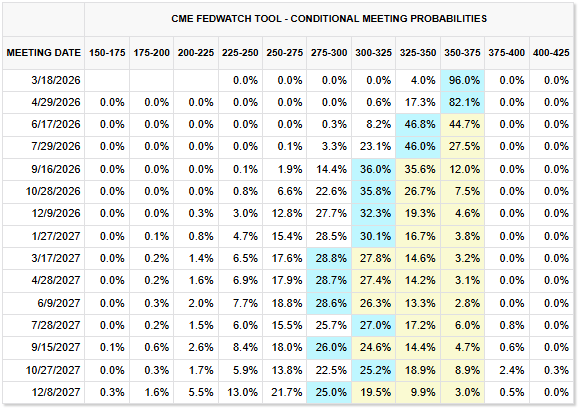
Source: CMEGROUP
This environment matters because a scenario without rate cuts removes one of the key structural supports for equity indices. If tariff tensions continue, they could further weaken the attractiveness of the Dow Jones and reinforce a dynamic of increased caution in the short term.
Confidence shows weakness
Uncertainty is also reflected in the Fear and Greed Index, which currently fluctuates around 37 points and remains in “fear” territory. The indicator’s negative slope suggests that market sentiment continues to deteriorate.
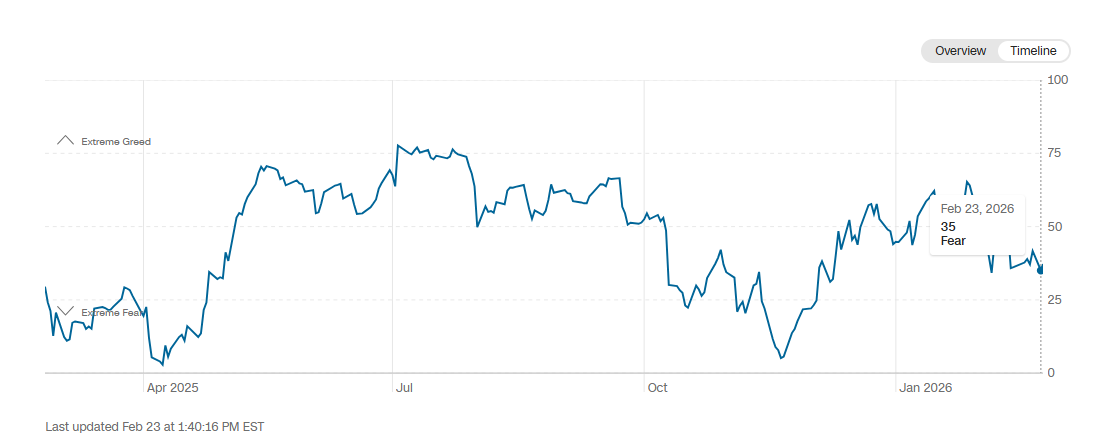
Source: CNN
If this weakness in confidence persists, it could hinder a sustained recovery in demand for risk assets. A move into “extreme fear” territory could intensify bearish pressure in upcoming Dow Jones sessions.
Technical outlook for the Dow Jones
Source: StoneX, Tradingview
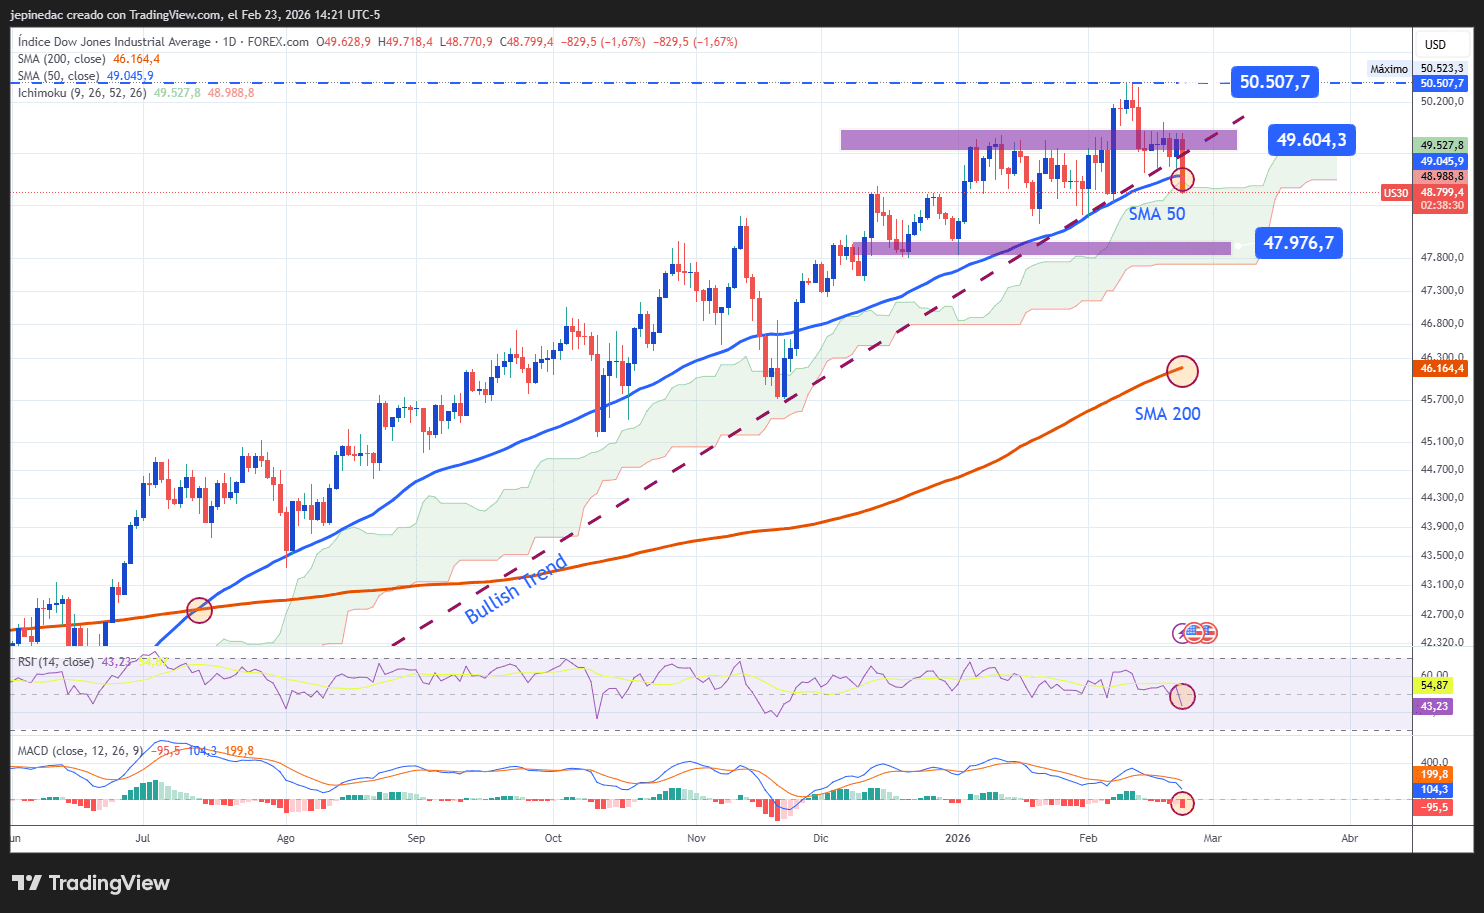
- Uptrend at risk: For several months, the Dow Jones maintained a consistent upward trendline. However, amid the current selling pressure, price has begun attempting to break below this structure in the short term. A confirmed breakdown could signal the end of the dominant pattern and open the door to a prolonged sideways phase or even the formation of a short-term downtrend.
- RSI: The indicator is positioned below the neutral 50 level, suggesting that the average momentum over the past 14 sessions favors a bearish bias. As long as the RSI continues forming lower lows, downward pressure could gain further relevance.
- MACD: The histogram remains below the zero line, reflecting that short-term moving averages maintain bearish dominance. If this dynamic persists, the current negative bias could intensify in the coming sessions.
Key levels:
- 50,500 points – Relevant resistance: Level near historical highs and the main bullish barrier. A sustained move toward this zone could reactivate a structural buying bias and restore strength to the prior trend.
- 49,600 points – Near-term barrier: Relevant neutral zone from recent sessions. If price fails to move decisively away from this level, a short-term sideways indecision scenario could consolidate.
- 47,900 points – Key support: Level located below the 50-period moving average. A sustained break below this zone would confirm a dominant bearish bias and open space for a clearer downward structure.
Written by Julian Pineda, CFA, CMT – Market Analyst
Follow him on: @julianpineda25
Related tags:




Open an account in minutes
Experience award-winning platforms with fast and secure execution, and enjoy tight spreads from 0.5 pts on FX and 0.3 pts on indices.
Economic calendar
Web Trader platform
Our sophisticated web-based platform is packed with features.
Related articles

Wall Street Forecast: DJIA rises on hawkish Fed expectations & rising yields
U.S. stocks are opening lower on Wednesday, pressured by higher crude oil prices and rising government bond yields, as investors await further developments from negotiations in the Middle East and ahead of a key U.S.-China summit.


ASX 200 Rebound Stalls Despite Wall Street Surge
The ASX 200 rebound is struggling for traction despite a powerful Wall Street rally, leaving 8800 resistance and downside risks in focus.


Nikkei threatens breakout as tech rebound broadens
Breakouts across the SOX and Nasdaq are being matched by rebounds across Asia, with the Nikkei now threatening to join the move.

This report is intended for general circulation only. It should not be construed as a recommendation, or an offer (or solicitation of an offer) to buy or sell any financial products. The information provided does not take into account your specific investment objectives, financial situation or particular needs. Before you act on any recommendation that may be contained in this report, independent advice ought to be sought from a financial adviser regarding the suitability of the investment product, taking into account your specific investment objectives, financial situation or particular needs.
StoneX Financial Pte. Ltd., may distribute reports produced by its respective foreign entities or affiliates within the StoneX group of companies or third parties pursuant to an arrangement under Regulation 32C of the Financial Advisers Regulations. Where the report is distributed to a person in Singapore who is not an accredited investor, expert investor or an institutional investor (as defined in the Securities Futures Act), StoneX Financial Pte. Ltd. accepts legal responsibility to such persons for the contents of the report only to the extent required by law. Singapore recipients should contact StoneX Financial Pte. Ltd. at 6826 9988 for matters arising from, or in connection with the report.
In the case of all other recipients of this report, to the extent permitted by applicable laws and regulations neither StoneX Financial Pte. Ltd. nor its associated companies will be responsible or liable for any loss or damage incurred arising out of, or in connection with, any use of the information contained in this report and all such liability is hereby expressly disclaimed. No representation or warranty is made, express or implied, that the content of this report is complete or accurate.
StoneX Financial Pte. Ltd. is not under any obligation to update this report.
Trading CFDs carries a high level of risk that may not be suitable for some investors. Consider your investment objectives, level of experience, financial resources, risk appetite and other relevant circumstances carefully. The possibility exists that you could lose some or all of your investments, including your initial deposits. If in doubt, please seek independent expert advice. Visit www.forex.com/en-sg/terms-and-policies for the complete Risk Disclosure Statement.