






Dow Jones Forecast: DJIA Maintains Bearish Bias Ahead of Fed Rate Decision
Despite having registered two consecutive recovery sessions, the index is now showing new declines, accumulating a loss of more than 5% over the last ten trading sessions.
Share this:

Despite having registered two consecutive recovery sessions, the index is now showing new declines, accumulating a loss of more than 5% over the last ten trading sessions. The bearish pressure persists, driven by market uncertainty due to the White House’s trade war and the upcoming Federal Reserve rate decision, which will be announced tomorrow.
The Fed’s Rate Decision Arrives
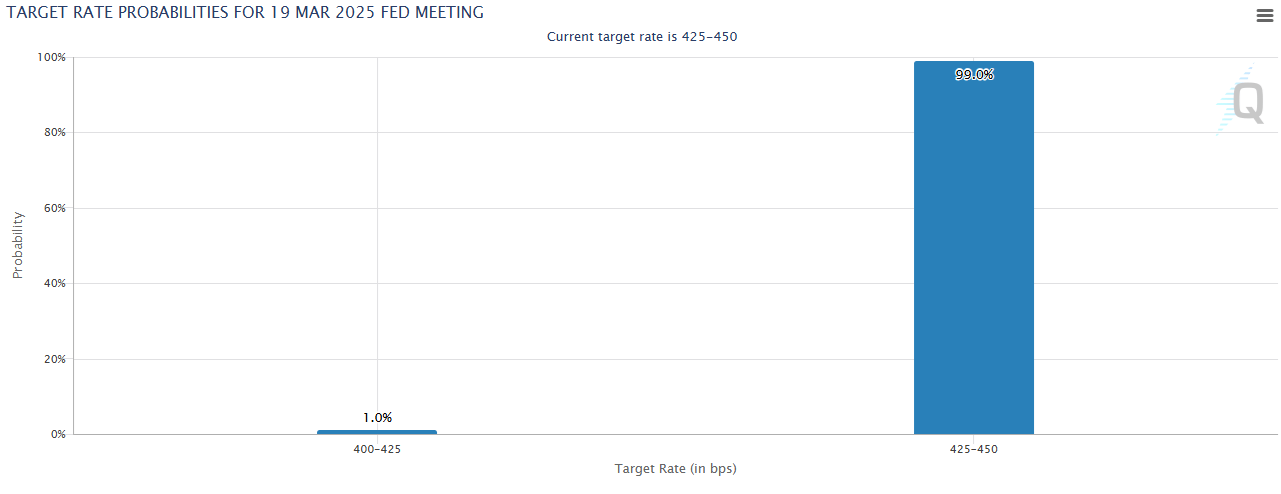
Tomorrow, March 19, the Federal Reserve is expected to announce its interest rate decision. Currently, the CME Group assigns a 99% probability that the central bank will keep rates unchanged, within the 4.25% - 4.5% range.
Source: CME Group
Given this outlook, the market appears to be anticipating a neutral monetary policy, keeping rates stable. However, the key focus will be on the speech by Fed Chair Jerome Powell following the decision. His remarks could provide clues as to whether the central bank will maintain its current stance or if it is considering rate cuts before mid-year.
As the decision approaches, the neutral sentiment in the Dow Jones is likely to persist throughout today’s session. However, it is essential to recognize that interest rate policy can have a direct impact on stock indices in the coming weeks.
If the Fed maintains rates at 4.5% for an extended period, borrowing costs for both businesses and consumers will remain high, potentially dampening domestic consumption and investment in the U.S. Over time, this could lead to lower sales and weaker earnings reports for major companies.
Additionally, market confidence remains unstable, prompting investors to shift towards fixed-income assets, such as Treasury bonds, which remain attractive due to their yields being tied to the Fed's rate. Both of these factors—the impact of high rates and the shift toward safer assets—could continue exerting downward pressure on the Dow Jones, sustaining the negative trend observed in recent sessions.
On the other hand, if Powell hints at a potential easing of monetary policy in the future, this could bolster market confidence and generate bullish pressure on the Dow Jones. So far, the market has not seen a rate cut since December 2024, and high rates have started to weigh heavily on economic performance.
What About the Trade War?
Since the announcement of 25% tariffs on products from Canada and Mexico, no agreement has been reached to lift these measures in the short term. Despite aggressive responses from the Canadian government, the policy remains in place, affecting all three North American economies.
Recently, the Organization for Economic Cooperation and Development (OECD) revised its 2025 growth forecasts downward. According to its projections:
- Mexico could enter a recession, with a 1.3% GDP contraction.
- Canada would maintain minimal growth of 0.7%.
- The United States is expected to grow its GDP by 2.2%.
While the trade war aims to strengthen the U.S. as a global economic power, in reality, tariffs could increase production costs and raise the prices of basic goods, leading to persistent inflation. Over the long term, the bleak economic outlook resulting from the trade war could remain a key driver of bearish pressure on the Dow Jones, particularly if confidence in the U.S. economy continues to deteriorate.
Dow Jones Technical Outlook
Source: StoneX, Tradingview
- Potential Double Top Formation: Since October 2024, the index’s fluctuations have formed a potential double top structure, with a peak at 45,000 points and support at 42,000 points. Currently, the price has made a bullish retracement to the base of the formation. However, if bearish pressure persists, confirmation of the pattern could signal a trend reversal, breaking the long-standing bullish trend and paving the way for a stronger selling movement in the upcoming sessions.
- Break of Long-Term Trendline: In early March, selling pressure broke a long-standing bullish trendline that had been intact for several months. This breakdown highlights the significance of current bearish pressure, suggesting that sellers have gained control of the market in the short term.
- RSI: The RSI line has begun to recover slightly above the oversold zone (30). If the RSI retests this area, it would indicate a persistent imbalance between supply and demand, potentially leading to bullish corrections in the coming sessions.
Key Levels:
- 43,000 points – Major Resistance: This level aligns with the breakout of the major long-term bullish trendline. If the price returns to this zone, it could reactivate the lateral consolidation seen in recent months, challenging the double top formation.
- 42,000 points – Near-Term Resistance: Coincides with the 200-period moving average and the support of the double top pattern. This could be the level where short-term bullish corrections may occur.
- 40,000 points – Critical Support: Positioned at a neutrality zone not seen since September 2024. This level could act as the final barrier for confirming a consolidated bearish trend, making it pivotal for determining the index’s direction in the coming sessions.
- 43,000 points – Major Resistance: This level aligns with the breakout of the major long-term bullish trendline. If the price returns to this zone, it could reactivate the lateral consolidation seen in recent months, challenging the double top formation.
Written by Julian Pineda, CFA – Market Analyst



Open an account in minutes
Experience award-winning platforms with fast and secure execution, and enjoy tight spreads from 0.5 pts on FX and 0.3 pts on indices.
Economic calendar
Web Trader platform
Our sophisticated web-based platform is packed with features.
Related articles

Gold Update: XAU/USD Remains Under Pressure Even After the NFP Report
As the trading week comes to an end, weakness around gold price action remains evident in the short term. This can be seen in the performance of the past two sessions, where the metal has declined by approximately 0.3%. Although the move has not been particularly aggressive, it highlights that buying pressure continues to struggle to regain control of the market.

Dow Jones Slide Shows What Rate Hike Bets Mean for Stocks
The Dow Jones support breakdown shows rising bond yields and rate hike bets hitting U.S. stocks while tech giants prop up the Nasdaq.


NFP Preview: Can the Jobs Report Overcome the Bond Market Meltdown Too?
Traders and economists expect the NFP report to show that the US created 90K net new jobs, with average hourly earnings rising 0.3% m/m (3.1% y/y) and the U3 unemployment rate at 4.1% - see what the leading indicators are suggesting!

This report is intended for general circulation only. It should not be construed as a recommendation, or an offer (or solicitation of an offer) to buy or sell any financial products. The information provided does not take into account your specific investment objectives, financial situation or particular needs. Before you act on any recommendation that may be contained in this report, independent advice ought to be sought from a financial adviser regarding the suitability of the investment product, taking into account your specific investment objectives, financial situation or particular needs.
StoneX Financial Pte. Ltd., may distribute reports produced by its respective foreign entities or affiliates within the StoneX group of companies or third parties pursuant to an arrangement under Regulation 32C of the Financial Advisers Regulations. Where the report is distributed to a person in Singapore who is not an accredited investor, expert investor or an institutional investor (as defined in the Securities Futures Act), StoneX Financial Pte. Ltd. accepts legal responsibility to such persons for the contents of the report only to the extent required by law. Singapore recipients should contact StoneX Financial Pte. Ltd. at 6826 9988 for matters arising from, or in connection with the report.
In the case of all other recipients of this report, to the extent permitted by applicable laws and regulations neither StoneX Financial Pte. Ltd. nor its associated companies will be responsible or liable for any loss or damage incurred arising out of, or in connection with, any use of the information contained in this report and all such liability is hereby expressly disclaimed. No representation or warranty is made, express or implied, that the content of this report is complete or accurate.
StoneX Financial Pte. Ltd. is not under any obligation to update this report.
Trading CFDs carries a high level of risk that may not be suitable for some investors. Consider your investment objectives, level of experience, financial resources, risk appetite and other relevant circumstances carefully. The possibility exists that you could lose some or all of your investments, including your initial deposits. If in doubt, please seek independent expert advice. Visit www.forex.com/en-sg/terms-and-policies for the complete Risk Disclosure Statement.