





Dow Jones Forecast: Technical Tuesday - June 17, 2025
Wall Street opened lower after US equity futures fell along with European markets overnight, as oil prices rose after Trump called for the evacuation of Tehran. The Dow Jones forecast was further undermined by a soft set or macro data.
Share this:

Wall Street opened lower after US equity futures fell along with European markets overnight, as oil prices rose after Trump called for the evacuation of Tehran. This caused the Dow to stay below the 200-day moving average, potentially triggering a technical bearish signal for the markets. Investors are watching the Israel-Iran war and wondering whether the US will be drawn into the conflict. Meanwhile, there was no trade agreement between the US and Japan, at the G7 meetings. Trump leaving the summit early means the prospects of any more deals look slim in the days ahead. The Dow Jones forecast was further undermined by a soft set or macro data, not least retail sales. Pointing to struggling US consumer, headline retail sales slumped 0.9% m/m while core sales slipped 0.3% m/m, both more than expected. Industrial Production, Capacity Utilization Rate and NAHB Housing Market Index all also came in weaker.
Trade uncertainty hangs over markets
Meanwhile, the July 9 deadline is approaching. That’s when the 90-day pause on reciprocal tariffs ends. It is quite possible that the deadline may get pushed out again to allow for more time for negotiations. But striking trade deals has been a lot more difficult to achieve than Trump had hoped. That is raising concerns for markets worried about higher inflation, especially with the geopolitical instability in the Middle East sending oil prices higher.
Trump leaves G7 summit early as Iran-Israel tensions rise
Donald Trump departed the G7 summit in Canada a day ahead of schedule, brushing aside speculation that his early exit was connected to brokering a ceasefire between Israel and Iran. According to the president, his reason for leaving was, in his words, “much bigger than that.”
He floated the possibility of dispatching either Senator JD Vance or real estate mogul Steven Witkoff to engage with Iranian officials, but firmly denied any claims that he had initiated peace overtures toward Tehran.
Earlier in the day, markets were slightly rattled after Trump called for the evacuation of the Iranian capital—remarks that injected a measure of alarm into an already volatile geopolitical situation. Oil pries rose again and down went stocks and future. Meanwhile, Israel pressed on with its bombardment of Iran, prompting a forceful response from Tehran in the form of missile and drone strikes.
Technical Dow Jones forecast: Index holds below 200-day average
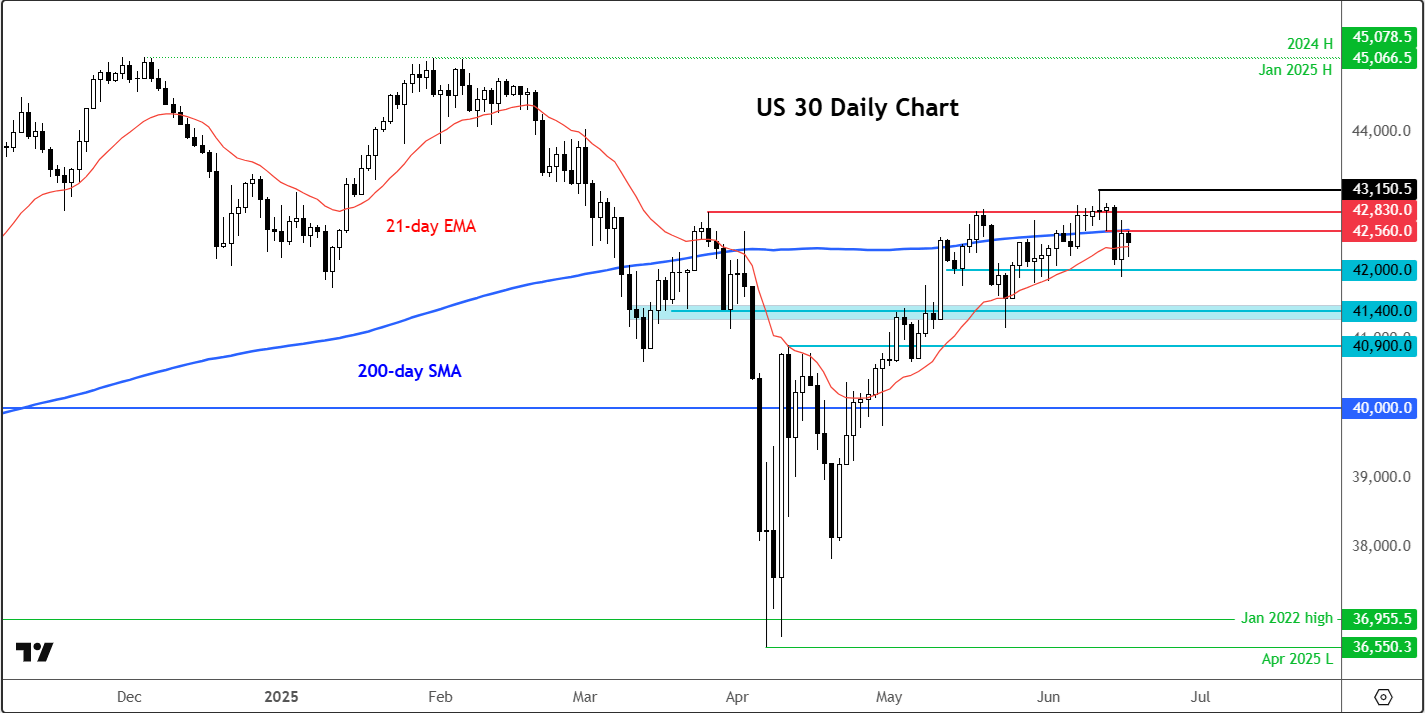
From a technical perspective, the Dow Jones chart is starting to look a little shaky again after the impressive rally from the April lows lost steam in the last few weeks. The index broke down on Friday after failing to hold above the key 42,830 level (the high it had created near the end of March, before Trump’s reciprocal tariffs caused markets to tank). With the market Dow refusing to hold above this level it shows investors are not ready to commit to the upside without any further progress in trade talks with major economies.
Source: TradingView.com
The fact that the Dow Jones chart has also broken below the 200-day moving average (around 42,560) is another bearish signal. This moving average has turned into resistance today, after the index failed to close above it the prior day.
If in the coming days the 200 day MA continues to offer a ceiling then this would tilt the Dow Jones forecast bearish from a technical perspective. In that case we could see a bit of a correction again as we head deeper into the summer, especially with pause on the 90-day pause on reciprocal tariffs looming on July 9.
If we do see some downside pressure, the first support that needs to break from a bearish perspective is at 42,000. Below that, liquidity testing below Monday’s range at 41,900 will come into focus. Then there is not much further support until around 41,400.
Meanwhile, a close above the aforementioned 42,830 level would be deemed a positive outcome. For the index to breach this threshold, you’d expect some further progress in trade talks with China.
-- Written by Fawad Razaqzada, Market Analyst
Follow Fawad on Twitter @Trader_F_R
How to trade with City Index
You can trade with City Index by following these four easy steps:
- Open an account, or log in if you’re already a customer
• Open an account in the UK
• Open an account in Australia
• Open an account in Singapore
- Search for the company you want to trade in our award-winning platform
- Choose your position and size, and your stop and limit levels
- Place the trade




Open an account in minutes
Experience award-winning platforms with fast and secure execution, and enjoy tight spreads from 0.5 pts on FX and 0.3 pts on indices.
Economic calendar
Web Trader platform
Our sophisticated web-based platform is packed with features.
Related articles

Why Crude Oil Slid While Middle East Tensions Kept Building
The crude oil pullback from monthly highs is running ahead of the headlines, as WTI and Brent ease while Middle East tensions stay unresolved.

Crude and dollar rebound as Trump says deal possible after the election
Donald Trump’s speech at the UN seems to have poured cold waters on any hopes of a deal. Crude oil, the US dollar and bond yields all bounced back from their lows, causing fresh pressure on foreign currencies, European indices and to a lesser degree precious metals.

USD/JPY and DXY Price Forecast: Bullish Rebound Faces Overbought Risks
Despite mounting geopolitical risks, crude oil prices have declined more than 10% from their monthly highs. Combined with overbought momentum readings on the DXY and dollar pairs, this increases the risk of a near-term reversal.
This report is intended for general circulation only. It should not be construed as a recommendation, or an offer (or solicitation of an offer) to buy or sell any financial products. The information provided does not take into account your specific investment objectives, financial situation or particular needs. Before you act on any recommendation that may be contained in this report, independent advice ought to be sought from a financial adviser regarding the suitability of the investment product, taking into account your specific investment objectives, financial situation or particular needs.
StoneX Financial Pte. Ltd., may distribute reports produced by its respective foreign entities or affiliates within the StoneX group of companies or third parties pursuant to an arrangement under Regulation 32C of the Financial Advisers Regulations. Where the report is distributed to a person in Singapore who is not an accredited investor, expert investor or an institutional investor (as defined in the Securities Futures Act), StoneX Financial Pte. Ltd. accepts legal responsibility to such persons for the contents of the report only to the extent required by law. Singapore recipients should contact StoneX Financial Pte. Ltd. at 6826 9988 for matters arising from, or in connection with the report.
In the case of all other recipients of this report, to the extent permitted by applicable laws and regulations neither StoneX Financial Pte. Ltd. nor its associated companies will be responsible or liable for any loss or damage incurred arising out of, or in connection with, any use of the information contained in this report and all such liability is hereby expressly disclaimed. No representation or warranty is made, express or implied, that the content of this report is complete or accurate.
StoneX Financial Pte. Ltd. is not under any obligation to update this report.
Trading CFDs carries a high level of risk that may not be suitable for some investors. Consider your investment objectives, level of experience, financial resources, risk appetite and other relevant circumstances carefully. The possibility exists that you could lose some or all of your investments, including your initial deposits. If in doubt, please seek independent expert advice. Visit www.forex.com/en-sg/terms-and-policies for the complete Risk Disclosure Statement.