





Dow Jones, S&P 500 Hit New Highs on Trade Optimism, ASX 200 To Follow?
Dow and S&P 500 hit record highs on trade hopes. Will the ASX 200 catch up amid bullish momentum and strong global risk sentiment?
Share this:
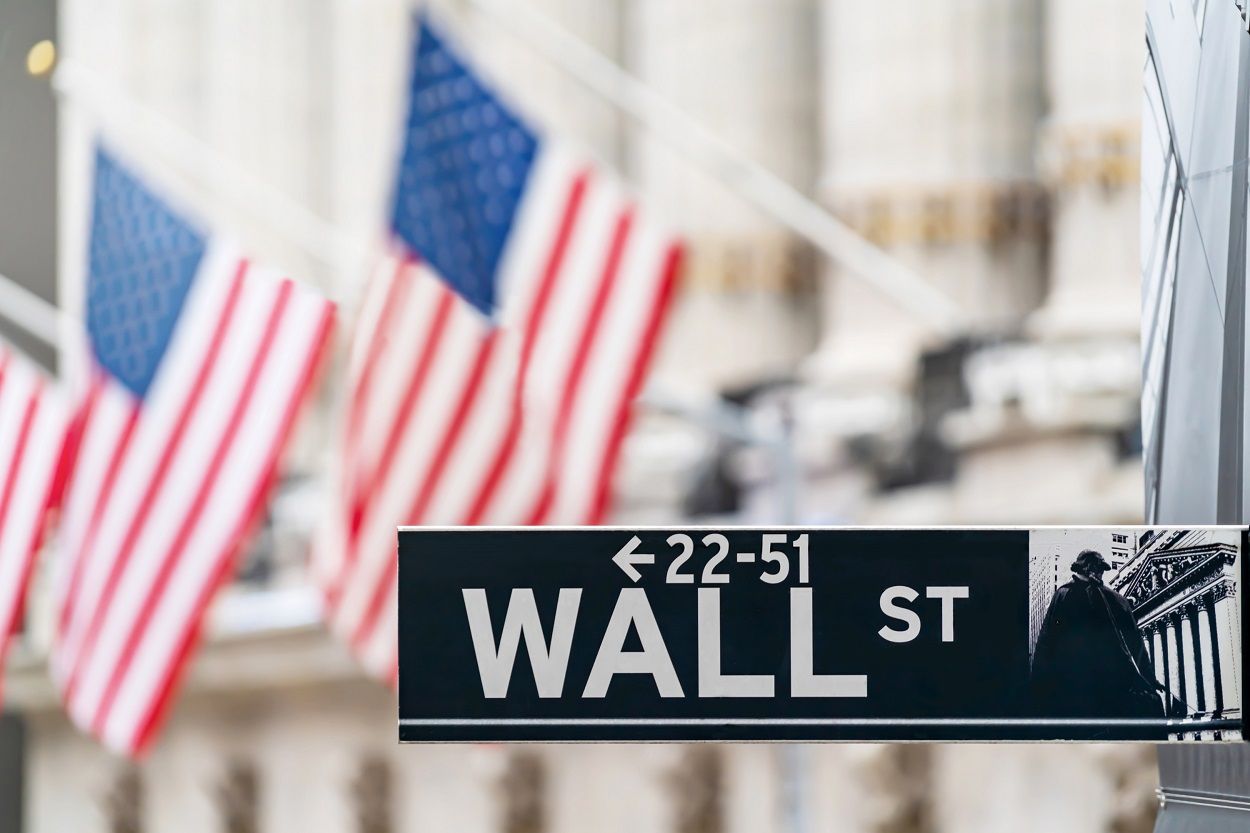
Wall Street indices reached record highs by Wednesday’s close on trade deal optimism. Trump’s announcement of a trade deal with Japan via Truth Social during Asian trade had sent the Nikkei 225 futures above 41k and within striking distance of its 2024 high. This then sparked expectations of a trade deal with the EU, with some reports suggesting 15% tariffs on most exports from the bloc.
The bullish mood extended to US and Australian equity futures, with traders maintaining a risk-on stance and eyeing higher targets. Below we break down the technical landscape for the S&P 500, Nasdaq 100, Dow Jones, and ASX 200 futures — along with today’s key economic events.
Dow Jones, S&P 500 Hit Record Highs, ASX 200 May Follow
Wall Street indices reached record highs by Wednesday’s close on trade deal optimism. Trump’s announcement of a trade deal with Japan via Truth Social during Asian trade had sent the Nikkei 225 futures above 41k and within striking distance of its 2024 high. This then sparked expectations of a trade deal with the EU, with some reports suggesting 15% tariffs on most exports from the block.
View related analysis:
View related analysis:
Wall Street Futures Technical Analysis: S&P 500, Nasdaq 100, Dow Jones
Wall Street indices continued higher, with the Dow Jones leading the way with a 1.1% gain and a close above 45,000. S&P 500 futures rose 0.8% to a new record high, while the Nasdaq 100 lagged behind.
The S&P 500 continues to use the 10-day EMA as support, and bullish momentum has strengthened at the highs, reflecting strong demand for US equities. While the daily RSI (2) and RSI (14) are both overbought, there are no bearish divergences warning of a pullback.
Until price action says otherwise, bulls are assumed to be in control and likely to retain a 'buy-the-dip' mentality. Note the gap target — projected from the April low to the runaway gap — sits around 6,638.
The Nasdaq 100 is also using the 10-day EMA as dynamic support, but it remains the clear laggard of the Wall Street indices. Its daily high failed to surpass last week's high, leaving a potential double top pattern on the daily chart. The daily RSI (2) has also dipped from overbought levels, showing a bearish divergence and signalling a loss of bullish momentum.
However, the bigger picture still assumes further upside, with its own runaway gap projecting an upside target around 23,365.
Dow Jones futures delivered a strong bullish breakout from recent consolidation. As the strongest performer of the day, it also shows the cleanest price action and potential to close some of the performance gap with the S&P 500. A move to 46,000 and a potential retest of its all-time high at 76,326 could now be on the cards.

Chart analysis by Matt Simpson, Source: TradingView, CME Futures, S&P 500 E-mini Futures, NASDAQ 100 E-mini Futures, Dow Jones E-mini Futures
ASX 200 Futures (SPI 200) Technical Analysis
I outlined my bullish bias for the ASX 200 and AUD/JPY in yesterday’s report, and both have turned higher amid the risk-on sentiment. The ASX 200 futures chart has formed a 3-day bullish reversal pattern known as a dark cloud cover. The fact it appeared at support (which previously acted as firm resistance) suggests we may have seen an important swing low on the daily chart.
A decent bullish trend has also emerged on the ASX 200 intraday chart. Bullish momentum overnight saw an upside break of a retracement line, and it looks like bulls could target Friday’s cash-session VPOC (volume point of control) at 8737.
I suspect we may see a bit of a shakeout or potential retracement around Friday’s high (8751), though like Wall Street traders, bulls seem more likely to view dips as opportunistic.

Chart analysis by Matt Simpson - Source: TradingView, ASX SPI 200 Index Futures, S&P/ASX 200 Index
Key Economic Events for Traders (AEST / GMT+10)
08:45 AUD Judo Bank Manufacturing PMI, Services PMI (Jul) (AUD/USD, ASX 200)
10:30 JPY au Jibun Bank Manufacturing PMI, Services PMI (Jul) (USD/JPY, Nikkei 225)
11:30 AUD RBA Bulletin (AUD/USD, ASX 200)
13:05 AUD RBA Gov Bullock Speaks (AUD/USD, ASX 200)
16:00 EUR GfK German Consumer Climate (Aug) (EUR/USD, DAX)
17:30 EUR HCOB Germany Composite, Manufacturing, Services PMI (Jul) (EUR/USD, DAX)
18:00 EUR HCOB Eurozone Composite, Manufacturing, Services PMI (Jul) (EUR/USD, DAX)
18:30 GBP S&P Global Composite, Manufacturing, Services PMI (Jul) (GBP/USD, FTSE 100)
22:15 EUR ECB Deposit Facility Rate, Interest Rate Decision, Monetary Policy Statement (EUR/USD, DAX)
22:30 USD Building Permits (MoM), Building Permits (Jun), Chicago Fed National Activity (Jun), Initial Jobless Claims (USD, S&P 500, Nasdaq 100, Dow Jones)
22:30 CAD Core Retail Sales, Retail Sales, Manufacturing Sales (May/Jun) (USD/CAD, TSX)
22:45 EUR ECB Press Conference (EUR/USD, DAX)
23:45 USD S&P Global Manufacturing, Services, Composite PMI (Jul) (USD, S&P 500)
00:00 USD New Home Sales (MoM), New Home Sales (Jun) (USD, S&P 500)
00:30 USD Natural Gas Storage (WTI Crude Oil, USD)
01:00 USD KC Fed Composite, Manufacturing Index (Jul) (USD, S&P 500)
03:00 USD 10-Year TIPS Auction (USD, Treasury Markets)

Open an account in minutes
Experience award-winning platforms with fast and secure execution, and enjoy tight spreads from 0.5 pts on FX and 0.3 pts on indices.
Economic calendar
Web Trader platform
Our sophisticated web-based platform is packed with features.
Related articles

EUR/USD forecast remains tilted lower with French bond troubles ahead of US jobs report
The EUR/USD has tagged a fresh year-to-date low as French public-finance concerns trigger a government bond sell-off. Today's US jobs report may change little, with resilient activity, elevated energy prices and hawkish Fed bets keeping the greenback supported. With the pair trapped below resistance at 1.1410, the risk to the near-term EUR/USD forecast is tilted to the downside.


USD/CAD shooting star puts September surge on notice
USD/CAD has printed a clear bearish reversal pattern after an extraordinary September surge, but confirmation may depend heavily on how US Treasury yields react to Friday’s payrolls report.


USD/CHF Reverses as Swiss Franc Surges amid Bond Carnage
USD/CHF reverses from channel resistance as bond volatility surges and broad Swiss franc strength points to a possible carry-trade unwind.
This report is intended for general circulation only. It should not be construed as a recommendation, or an offer (or solicitation of an offer) to buy or sell any financial products. The information provided does not take into account your specific investment objectives, financial situation or particular needs. Before you act on any recommendation that may be contained in this report, independent advice ought to be sought from a financial adviser regarding the suitability of the investment product, taking into account your specific investment objectives, financial situation or particular needs.
StoneX Financial Pte. Ltd., may distribute reports produced by its respective foreign entities or affiliates within the StoneX group of companies or third parties pursuant to an arrangement under Regulation 32C of the Financial Advisers Regulations. Where the report is distributed to a person in Singapore who is not an accredited investor, expert investor or an institutional investor (as defined in the Securities Futures Act), StoneX Financial Pte. Ltd. accepts legal responsibility to such persons for the contents of the report only to the extent required by law. Singapore recipients should contact StoneX Financial Pte. Ltd. at 6826 9988 for matters arising from, or in connection with the report.
In the case of all other recipients of this report, to the extent permitted by applicable laws and regulations neither StoneX Financial Pte. Ltd. nor its associated companies will be responsible or liable for any loss or damage incurred arising out of, or in connection with, any use of the information contained in this report and all such liability is hereby expressly disclaimed. No representation or warranty is made, express or implied, that the content of this report is complete or accurate.
StoneX Financial Pte. Ltd. is not under any obligation to update this report.
Trading CFDs carries a high level of risk that may not be suitable for some investors. Consider your investment objectives, level of experience, financial resources, risk appetite and other relevant circumstances carefully. The possibility exists that you could lose some or all of your investments, including your initial deposits. If in doubt, please seek independent expert advice. Visit www.forex.com/en-sg/terms-and-policies for the complete Risk Disclosure Statement.