



Equities 2026 Outlook: A Rare Alignment for SPX, NDX (Technical)
After an early year sell-off equities ripped with the Nasdaq gaining as much as 58.27% in a little more than six months, and a rare alignment of expansionary fiscal and soft monetary policy can continue to push trends in 2026.
Share this:

It was in last year’s US equities forecast that I made the connection between the frothy conditions of the AI boom to the Dot Com bubble thirty years earlier. By the end of 2025 that had become a much more common narrative and as we go into 2026, valuations are without a doubt concerning. But, as I said a year ago, a growing bubble doesn’t necessarily mean a market condition ready to ‘pop’ and as we push into the New Year, I remain of the mind that there’s more to go before we see reversion to the mean. And, for now, pullbacks are buying opportunities as stocks have continued to stretch towards fresh all-time-highs.

In my Q4 Forecast, I provided a year-end profit target of 6958 for SPX and as I write this with two weeks remaining in the year, that remains an attainable target. On October 29th, the date of the Fed’s second rate cut of the cycle, the index came within 0.5% of that level before pulling back. That pullback was ultimately driven by fear that the Fed might avoid a December rate cut, which ended up going through anyways, but that driver highlights what’s important for stocks as we push into 2026 trade.
SPX Weekly Price Chart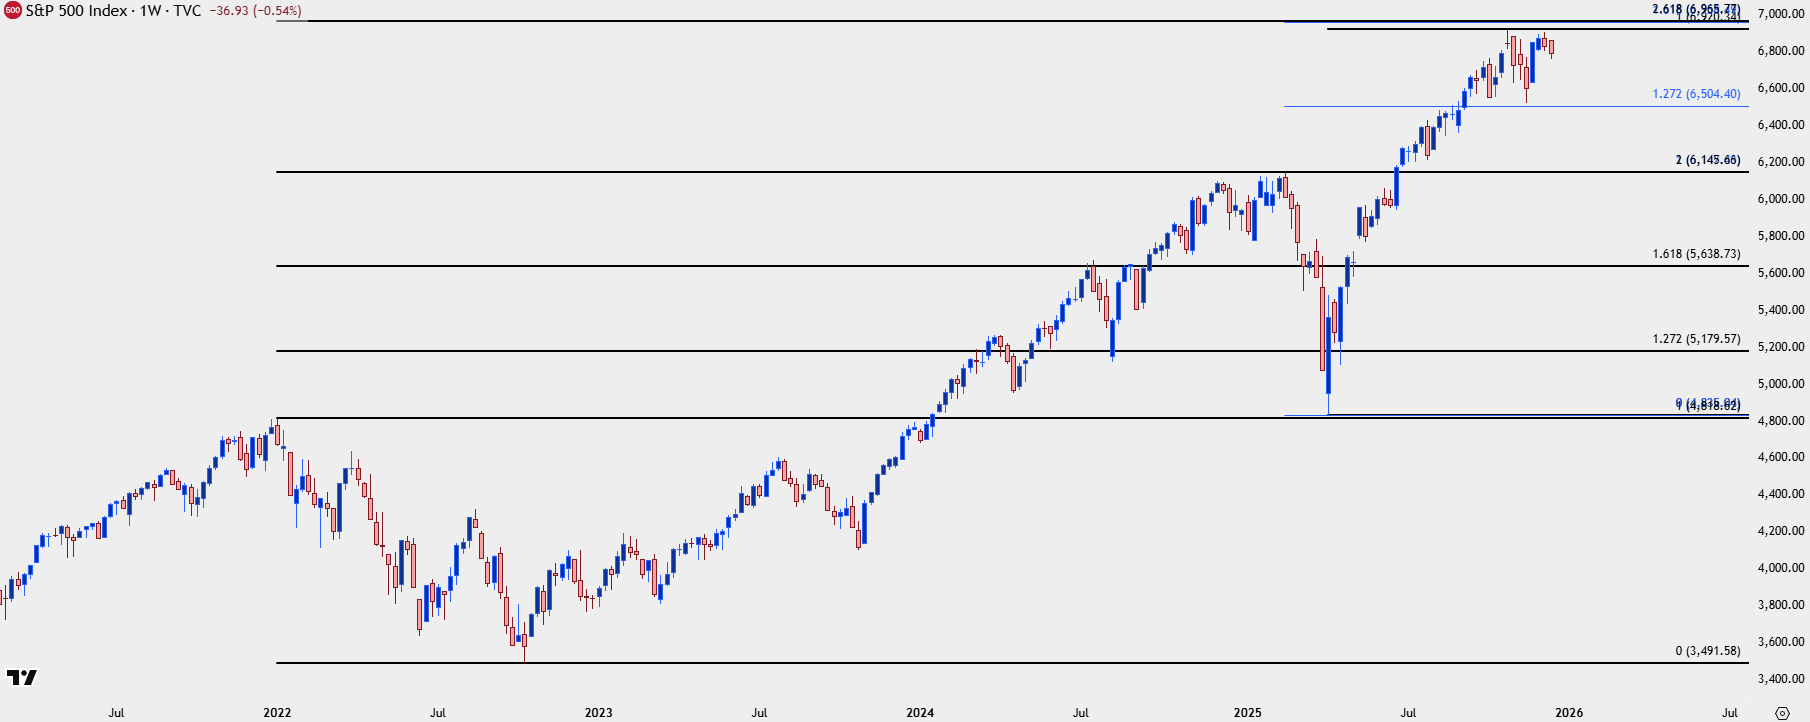
Chart prepared by James Stanley; data derived from Tradingview
2026 Equities Forecast: Technicals
SPX Target: 7500
For 2026 I’m looking for a target of 7500 on SPX. This is a confluent spot with both the 27.2% extension of the April-October rally and a 100% measured move of the early-2025 sell-off. That structure was validated a couple of different times, in my opinion, as the 27.2% extension was resistance that was later defended as support, and the 61.8% extension was my 2025 year-end target which was less than 0.5% away from the high; and with two weeks left in the year remains a viable target by year-end.
SPX Daily Price Chart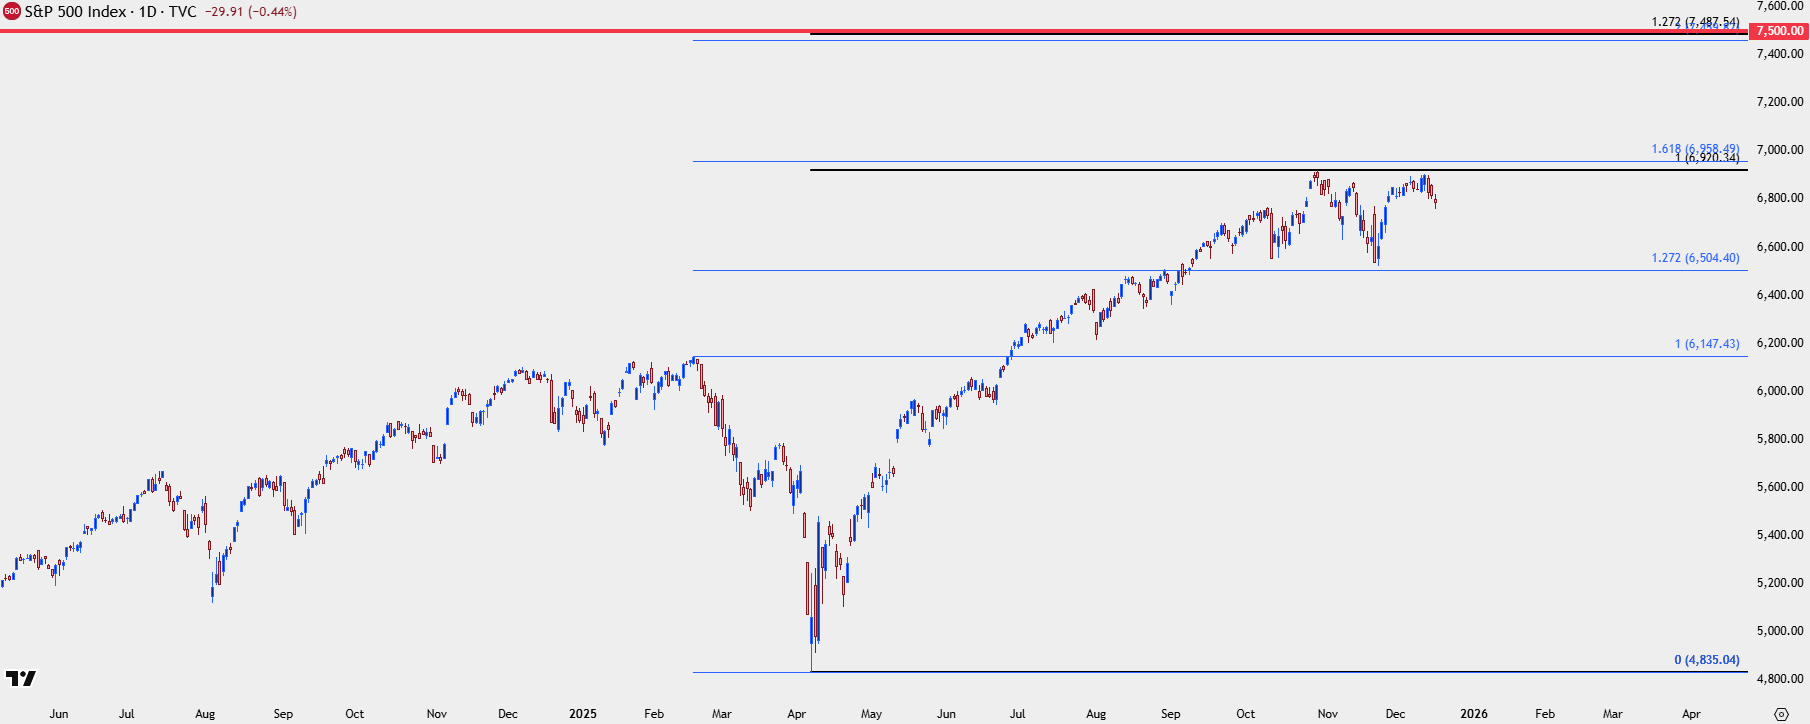
Chart prepared by James Stanley; data derived from Tradingview
Nasdaq 100
In the 2025 Forecast and for my top trade idea for the year, I looked at the long side of equities but only after a pullback. In the Nasdaq, it was my third level of support, around the 17k level that was tested at the April lows and ultimately led into a massive rally of 58.27% into the 2025 high.
For next year my stance is the same: The long side remains attractive but from a risk management perspective price is simply too high to chase up to higher-highs. So, for pullbacks, there remains interest for continuation scenarios and the spot that I think would ideally come into play is the 24k level that was resistance-turned-support. Below that, the 22,133-22,500 area is of interest, and the 20k-20224 zone can also be argued as an ‘s3’ spot of support. If bulls can’t hold prices above that then we’re likely already seeing some significant change on the horizon.
Nasdaq 100 Daily Chart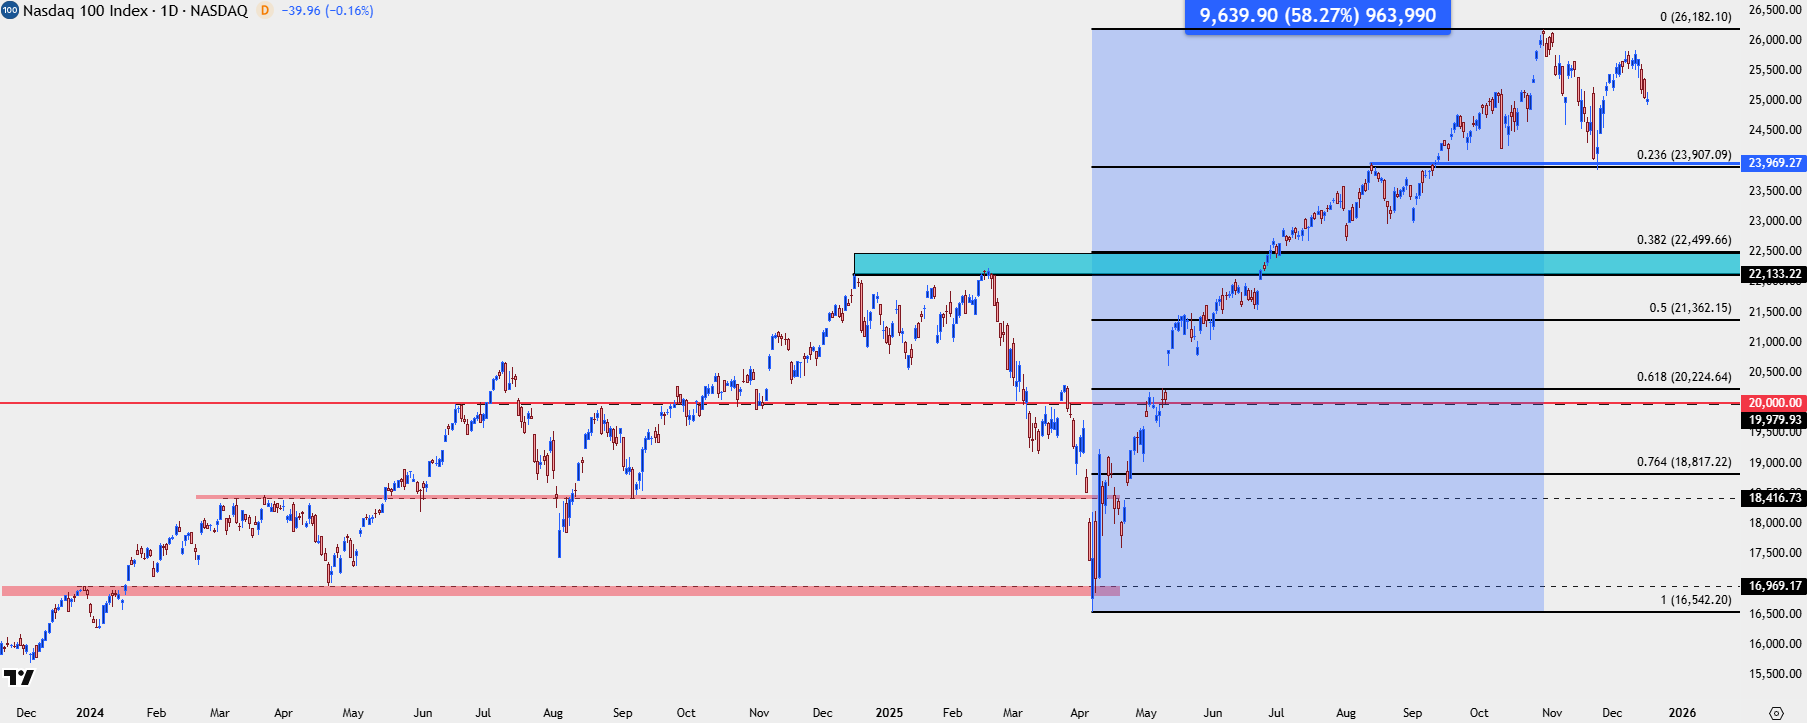
Chart prepared by James Stanley; data derived from Tradingview
--- written by James Stanley, Senior Market Analyst, Global Macro
Related tags:
Latest market news



Open an account in minutes
Experience award-winning platforms with fast and secure execution, and enjoy tight spreads from 0.5 pts on FX and 0.3 pts on indices.
Economic calendar
Web Trader platform
Our sophisticated web-based platform is packed with features.
Related articles

S&P 500, Nasdaq, Dow Forecast: Rising Yields Test Rally Ahead of Nvidia, Fed 8 22 2026
S&P 500, Nasdaq and Dow test key technical levels as momentum fades, raising the risk of a deeper correction heading into a pivotal week.

Magnificent Seven Earnings Preview: Can Big Tech Reclaim AI Leadership?
The Magnificent Seven enter earnings with far more divided performance than in previous years, as investors increasingly distinguish between companies supplying the AI buildout and those funding it - what does that mean heading into earnings season?


Nasdaq 100 Coils Ahead of ASML Earnings as AI Leadership Faces a Test
The Nasdaq 100 consolidates ahead of ASML earnings as leadership fades, market breadth improves and traders await fresh clues on AI demand.

This report is intended for general circulation only. It should not be construed as a recommendation, or an offer (or solicitation of an offer) to buy or sell any financial products. The information provided does not take into account your specific investment objectives, financial situation or particular needs. Before you act on any recommendation that may be contained in this report, independent advice ought to be sought from a financial adviser regarding the suitability of the investment product, taking into account your specific investment objectives, financial situation or particular needs.
StoneX Financial Pte. Ltd., may distribute reports produced by its respective foreign entities or affiliates within the StoneX group of companies or third parties pursuant to an arrangement under Regulation 32C of the Financial Advisers Regulations. Where the report is distributed to a person in Singapore who is not an accredited investor, expert investor or an institutional investor (as defined in the Securities Futures Act), StoneX Financial Pte. Ltd. accepts legal responsibility to such persons for the contents of the report only to the extent required by law. Singapore recipients should contact StoneX Financial Pte. Ltd. at 6826 9988 for matters arising from, or in connection with the report.
In the case of all other recipients of this report, to the extent permitted by applicable laws and regulations neither StoneX Financial Pte. Ltd. nor its associated companies will be responsible or liable for any loss or damage incurred arising out of, or in connection with, any use of the information contained in this report and all such liability is hereby expressly disclaimed. No representation or warranty is made, express or implied, that the content of this report is complete or accurate.
StoneX Financial Pte. Ltd. is not under any obligation to update this report.
Trading CFDs carries a high level of risk that may not be suitable for some investors. Consider your investment objectives, level of experience, financial resources, risk appetite and other relevant circumstances carefully. The possibility exists that you could lose some or all of your investments, including your initial deposits. If in doubt, please seek independent expert advice. Visit www.forex.com/en-sg/terms-and-policies for the complete Risk Disclosure Statement.