






EUR/USD, WTI crude oil tread water ahead of NFP: European open – 06/09/2023
It has been an action-packed week for markets, which has meant that price action ahead of today’s nonfarm payroll report has been quieter than usual. But that doesn't mean it will stay quiet heading into the weekend. Today we look at key levels on the intraday charts of EUR/USD and WTI crude oil.
Share this:

Asian Indices:
- Australia's ASX 200 index rose by 35 points (0.51%) and currently trades at 6,960.50
- Japan's Nikkei 225 index has fallen by 0.44 points (0%) and currently trades at 31,075.80
- Hong Kong's Hang Seng index has risen by 312.21 points (1.81%) and currently trades at 17,526.08
- China's A50 Index has fallen by -72.69 points (-0.58%) and currently trades at 12,398.05
UK and Europe:
- UK's FTSE 100 futures are currently up 28.5 points (0.38%), the cash market is currently estimated to open at 7,480.04
- Euro STOXX 50 futures are currently up 16 points (0.39%), the cash market is currently estimated to open at 4,115.81
- Germany's DAX futures are currently up 58 points (0.38%), the cash market is currently estimated to open at 15,128.22
US Futures:
- DJI futures are currently down -10 points (-0.03%)
- S&P 500 futures are currently down -2 points (-0.05%)
- Nasdaq 100 futures are currently up 3.75 points (0.03%)
Events in focus (GMT+1):
- 23:30 – Nonfarm payroll
- 23:30 – Canadian employment report
It has been an action-packed week for markets, which has meant that price action ahead of today’s nonfarm payroll report has been quieter than usual. Looking through the numbers, consensus expectations have pencilled in a slightly cooler labour market – but not by any worrying degree. Job growth is expected to cool to 170k from 187k, private payrolls down to 160k from 179k, whilst average hourly earnings are forecast to remain steady at 34.4hrs and the unemployment rate pull back to 3.7% from 3.8%. These numbers hardly ring alarm bells and we’re going to need to see some large deviations away from these headline figures to get volatility pumping.
Take note that the Canadian employment report is released alongside NFP at 13:30 BST, but unless we see a clear divergence between US and Canada’s figures then it likely results in choppy and difficult trading conditions for USD/CAD.
- European futures are higher ahead of the cash market open
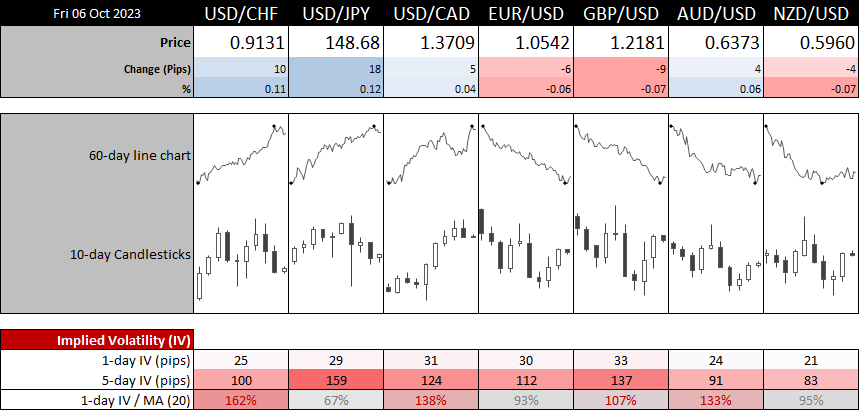
- Forex ranges were razor thin during the Asian session, and their 1-day implied volatility levels have not exactly blown out either
- We’re keeping a close eye to see if gold can turn higher from the support level above $1800
- AUD/JPY has caught our eye for a potential swing trade short if sentiment sours once more (yes yields… we’re looking your way)
EUR/USD technical analysis (1-hour chart):
The weaker US dollar allowed the euro to rise for a second day, in line with yesterday’s bias. Although it didn’t quite reach the upside targets around 1.0560. But that’s not to say it can’t, with a nonfarm payroll report pending.
The upper 1-day implied volatility band sits right near the weekly pivot point, volume node and bearish trendline, which makes the 1.05670 area of interest. Perhaps prices could drift higher today ahead of the report, in which case a strong NFP report could weigh on the euro and tempt bears for a move towards (and potentially below) 1.0500. Also note the bearish RSI divergence forming to show a weakness to the current 2-day rally and prices are forming a potential rising wedge (which isa bearish pattern within a downtrend).
But if it can break above the resistance area, then perhaps we’re looking at a move beyond 1.0600 next week.
WTI crude oil technical analysis (daily chart):
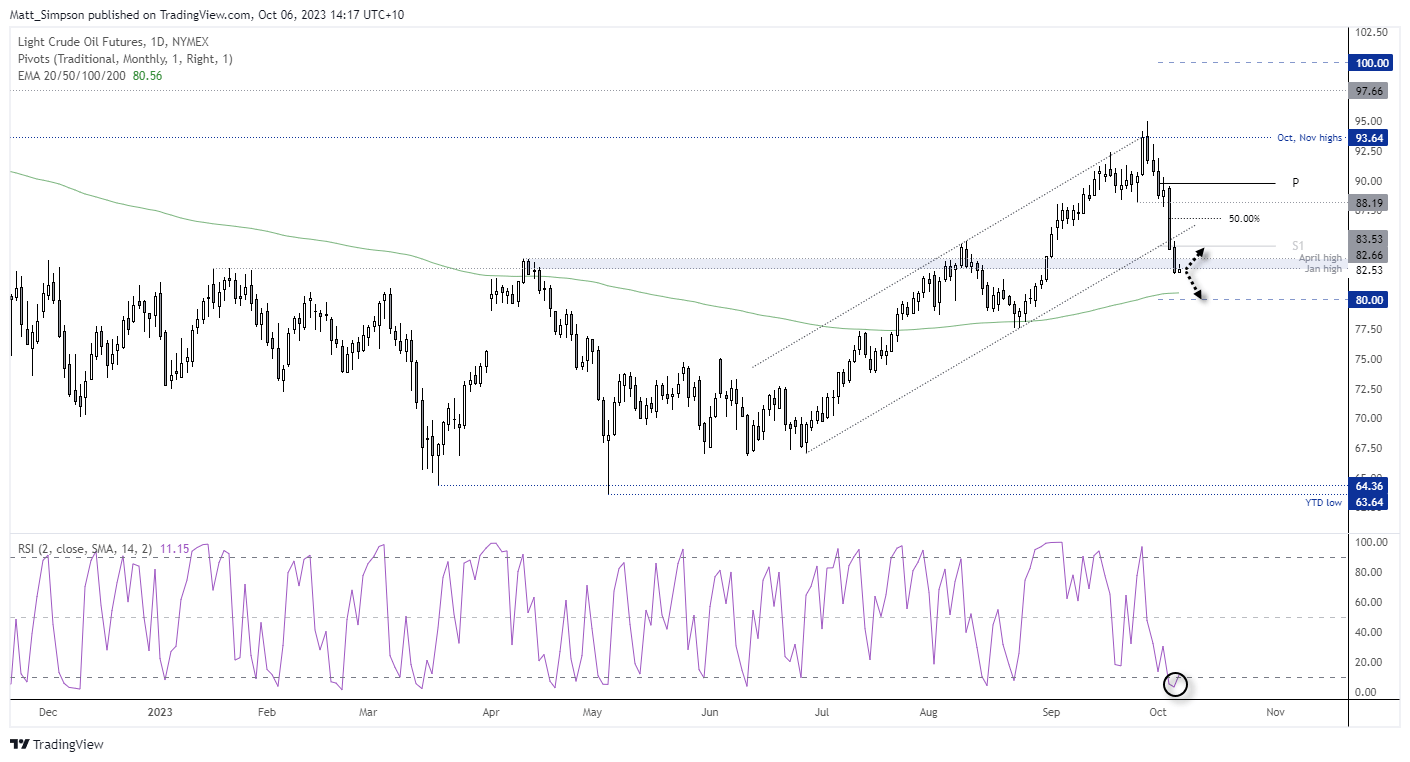
It has been a brutal week for oil prices, with WTI crude oil having fallen nearly 14% in just five days. It saw a clear close beneath the January and April highs, and if we’re to be ‘treated’ to a weak nonfarm payrolls report oil could continue lower on the renewed concerns of a recession (which tend to dent the demand outlook for oil prices). Should bears maintain control, $80 is the next major levels for bulls to defend, near the 200-day EMA.
With that said, RSI (2) is trying to curl its way higher from the oversold level to suggest oil prices could be approaching a near-term, inflection point.
WTI crude oil technical analysis (1-hour chart):
The 1-hour chart shows that volatility has picked up near the cycle lows, which is not something you typically see after a strong move (as volatility usually diminishes). If anything is to be gleaned from that information, it could be that there’s a bit of a battle around these lows and prices are refusing to go immediately lower.
And with the RSI (14) forming a bullish divergence, I don’t think an initial move towards $85 sounds so crazy, near the weekly R2 pivot level. At which point I’d reconsider its potential to extends its move higher, or form a swing high and head towards $80.
View the full economic calendar
View the full economic calendar
-- Written by Matt Simpson
Follow Matt on Twitter @cLeverEdge
How to trade with City Index
You can trade with City Index by following these four easy steps:
- Open an account, or log in if you’re already a customer
• Open an account in the UK
• Open an account in Australia
• Open an account in Singapore
- Search for the market you want to trade in our award-winning platform
- Choose your position and size, and your stop and limit levels
- Place the trade
Related tags:


Open an account in minutes
Experience award-winning platforms with fast and secure execution, and enjoy tight spreads from 0.5 pts on FX and 0.3 pts on indices.
Economic calendar
Web Trader platform
Our sophisticated web-based platform is packed with features.
Related articles

USD/CAD forecast: rally could accelerate above June highs at 1.4250
USD/CAD recovered quickly after weaker US jobs data, keeping the bullish trend in focus. A move above the June highs could accelerate the rally as inflation keeps the Fed under pressure.


USD Sets Fresh Yearly High as EUR/USD Drops Dramatically, USD/JPY Stable
Well, it was a week of USD strength that wasn’t entirely pushed by USD/JPY, as a strong sell-off in EUR/USD has pushed the major pair to its most oversold state in a decade.

Dow Jones Slide Shows What Rate Hike Bets Mean for Stocks
The Dow Jones support breakdown shows rising bond yields and rate hike bets hitting U.S. stocks while tech giants prop up the Nasdaq.
This report is intended for general circulation only. It should not be construed as a recommendation, or an offer (or solicitation of an offer) to buy or sell any financial products. The information provided does not take into account your specific investment objectives, financial situation or particular needs. Before you act on any recommendation that may be contained in this report, independent advice ought to be sought from a financial adviser regarding the suitability of the investment product, taking into account your specific investment objectives, financial situation or particular needs.
StoneX Financial Pte. Ltd., may distribute reports produced by its respective foreign entities or affiliates within the StoneX group of companies or third parties pursuant to an arrangement under Regulation 32C of the Financial Advisers Regulations. Where the report is distributed to a person in Singapore who is not an accredited investor, expert investor or an institutional investor (as defined in the Securities Futures Act), StoneX Financial Pte. Ltd. accepts legal responsibility to such persons for the contents of the report only to the extent required by law. Singapore recipients should contact StoneX Financial Pte. Ltd. at 6826 9988 for matters arising from, or in connection with the report.
In the case of all other recipients of this report, to the extent permitted by applicable laws and regulations neither StoneX Financial Pte. Ltd. nor its associated companies will be responsible or liable for any loss or damage incurred arising out of, or in connection with, any use of the information contained in this report and all such liability is hereby expressly disclaimed. No representation or warranty is made, express or implied, that the content of this report is complete or accurate.
StoneX Financial Pte. Ltd. is not under any obligation to update this report.
Trading CFDs carries a high level of risk that may not be suitable for some investors. Consider your investment objectives, level of experience, financial resources, risk appetite and other relevant circumstances carefully. The possibility exists that you could lose some or all of your investments, including your initial deposits. If in doubt, please seek independent expert advice. Visit www.forex.com/en-sg/terms-and-policies for the complete Risk Disclosure Statement.