





Euro Taking It on the Chin a
EUR/GBP has been getting slammed all day
Share this:

With the DXY going bid most of the US session because of positive China-US trade talk headlines, it’s only natural for the EUR/USD to have sold off today. The Euro currently makes up about 57% of the US Dollar Index. Currently EUR/USD is down -.55% at 1.1066. With the DXY up +.41% on the day, one may expect GBP/USD to be lower as well. However, the pair is actually just about unchanged. Granted, Sterling makes up only about 12% of the DXY, however usually if EUR/USD were to move lower, the GBP/USD would follow suit. There were no major headlines today regarding Brexit, so that isn’t why GBP/USD is holding up. However, if EUR/USD is falling, and GBP/USD is unchanged, something has to give. The answer lies in the cross currency, EUR/GBP!
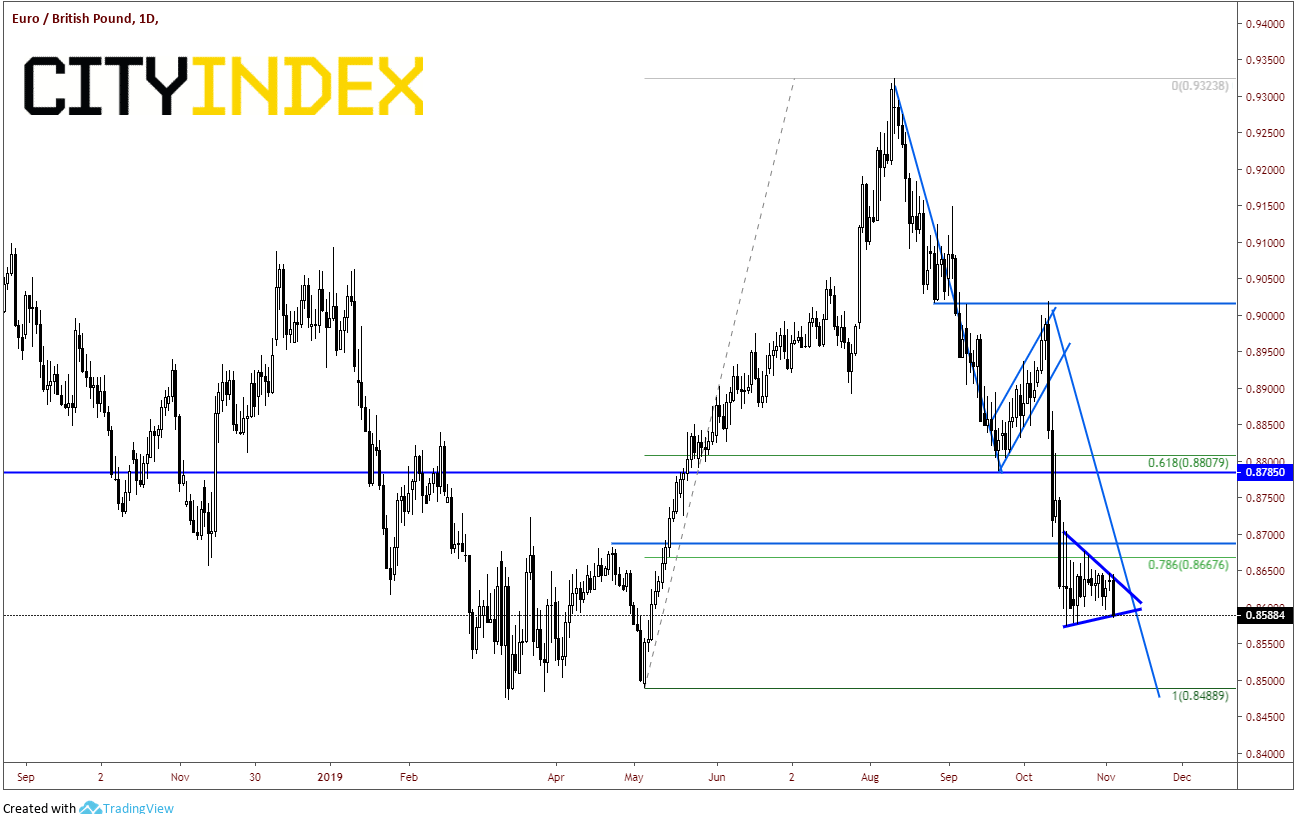
EUR/GBP has been getting slammed all day, which means the Euro is heading lower while the Pound is going higher. The cross currency is currently down nearly -.60% at .8685 (down 50 pips on the day). The pair formed a flag pattern on a daily timeframe during the month of September and halted its selloff from the break lower towards the flag target at .8488. The pair has been forming a symmetrical triangle since mid-October between .8580 and .8700 and is currently trading near the apex.
Source: Tradingview, City Index
On a 240-minute chart the symmetrical is clearer, and it looks as if EUR/GBP is trying to push through the lower trendline of the triangle. If this is the case, the target is close to .8400 (whereas the target from the flag on the daily is .8488.)
Source: Tradingview, City Index
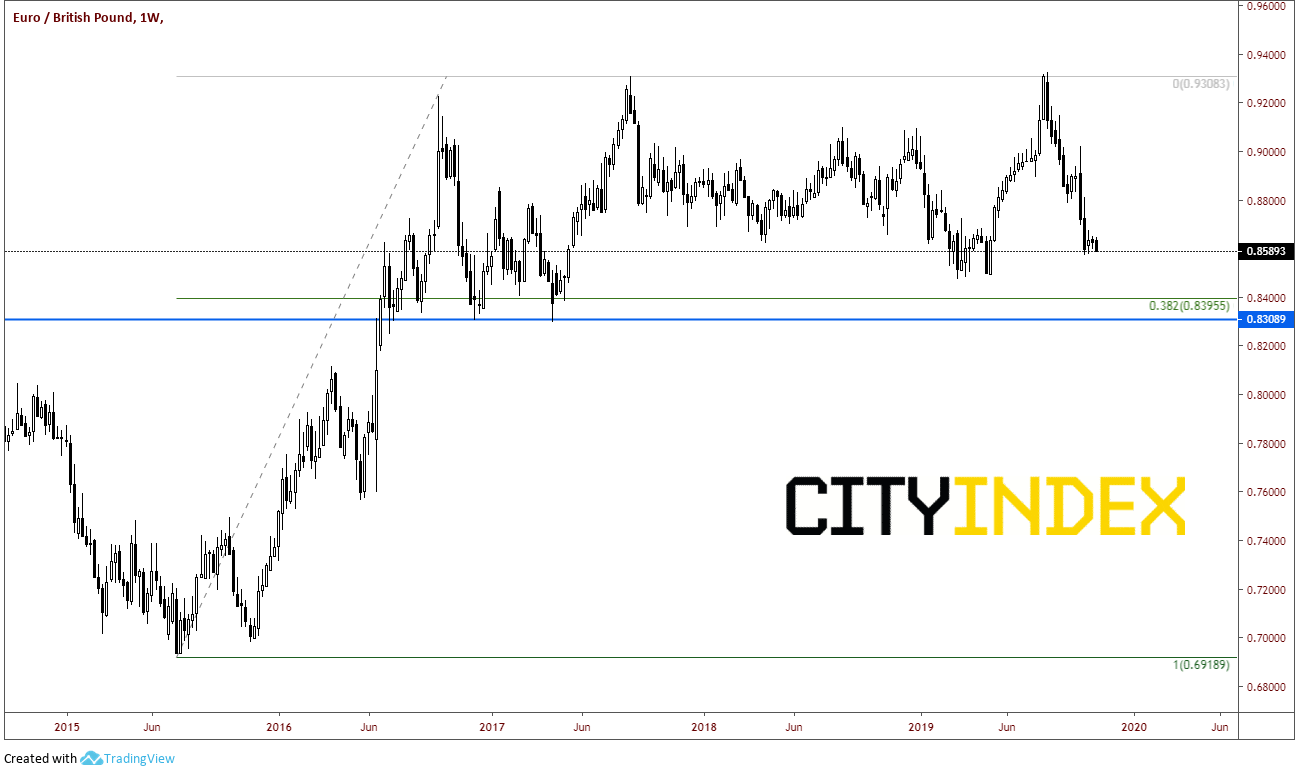
Looking at the daily chart, there isn’t any support until the daily flag target, which is also lows from March and May, near .8475/.8500. To find support below there, we need to look at a weekly chart. The 38.2% retracement level from the lows of July 2015 to the highs in August 2019 is .8400 (which is also the target of the triangle on the 240-minute chart. Below there, horizontal support comes across at .8308.
Source: Tradingview, City Index
If EUR/GBP does manage to hold within the triangle and bounce, resistance would be at the top, downward sloping trendline from the triangle near .8640. Above that, there is horizontal resistance at .8715.
Brexit headlines are usually key for movements in EUR/GBP. However, with campaigning for elections ongoing, headlines may be sparse for a while, which may keep GBP/USD steady. As we see today though, movement may come via EUR/USD and China headlines!
With the DXY going bid most of the US session because of positive China-US trade talk headlines, it’s only natural for the EUR/USD to have sold off today. The Euro currently makes up about 57% of the US Dollar Index. Currently EUR/USD is down -.55% at 1.1066. With the DXY up +.41% on the day, one may expect GBP/USD to be lower as well. However, the pair is actually just about unchanged. Granted, Sterling makes up only about 12% of the DXY, however usually if EUR/USD were to move lower, the GBP/USD would follow suit. There were no major headlines today regarding Brexit, so that isn’t why GBP/USD is holding up. However, if EUR/USD is falling, and GBP/USD is unchanged, something has to give. The answer lies in the cross currency, EUR/GBP!
EUR/GBP has been getting slammed all day, which means the Euro is heading lower while the Pound is going higher. The cross currency is currently down nearly -.60% at .8685 (down 50 pips on the day). The pair formed a flag pattern on a daily timeframe during the month of September and halted its selloff from the break lower towards the flag target at .8488. The pair has been forming a symmetrical triangle since mid-October between .8580 and .8700 and is currently trading near the apex.
Source: Tradingview, FOREX.com
On a 240-minute chart the symmetrical is clearer, and it looks as if EUR/GBP is trying to push through the lower trendline of the triangle. If this is the case, the target is close to .8400 (whereas the target from the flag on the daily is .8488.)
Source: Tradingview, FOREX.com
Looking at the daily chart, there isn’t any support until the daily flag target, which is also lows from March and May, near .8475/.8500. To find support below there, we need to look at a weekly chart. The 38.2% retracement level from the lows of July 2015 to the highs in August 2019 is .8400 (which is also the target of the triangle on the 240-minute chart. Below there, horizontal support comes across at .8308.
Source: Tradingview, FOREX.com
If EUR/GBP does manage to hold within the triangle and bounce, resistance would be at the top, downward sloping trendline from the triangle near .8640. Above that, there is horizontal resistance at .8715.
Brexit headlines are usually key for movements in EUR/GBP. However, with campaigning for elections ongoing, headlines may be sparse for a while, which may keep GBP/USD steady. As we see today though, movement may come via EUR/USD and China headlines!


Open an account in minutes
Experience award-winning platforms with fast and secure execution, and enjoy tight spreads from 0.5 pts on FX and 0.3 pts on indices.
Economic calendar
Web Trader platform
Our sophisticated web-based platform is packed with features.
Related articles
USD/JPY weekly outlook: Quarter turn scrambles rates regime
USD/JPY’s tight relationship with front-end US rates broke down sharply last week, but quarter-turn flows and positioning suggest the disconnect may prove temporary.

USD/CAD forecast: rally could accelerate above June highs at 1.4250
USD/CAD recovered quickly after weaker US jobs data, keeping the bullish trend in focus. A move above the June highs could accelerate the rally as inflation keeps the Fed under pressure.


USD Sets Fresh Yearly High as EUR/USD Drops Dramatically, USD/JPY Stable
Well, it was a week of USD strength that wasn’t entirely pushed by USD/JPY, as a strong sell-off in EUR/USD has pushed the major pair to its most oversold state in a decade.

This report is intended for general circulation only. It should not be construed as a recommendation, or an offer (or solicitation of an offer) to buy or sell any financial products. The information provided does not take into account your specific investment objectives, financial situation or particular needs. Before you act on any recommendation that may be contained in this report, independent advice ought to be sought from a financial adviser regarding the suitability of the investment product, taking into account your specific investment objectives, financial situation or particular needs.
StoneX Financial Pte. Ltd., may distribute reports produced by its respective foreign entities or affiliates within the StoneX group of companies or third parties pursuant to an arrangement under Regulation 32C of the Financial Advisers Regulations. Where the report is distributed to a person in Singapore who is not an accredited investor, expert investor or an institutional investor (as defined in the Securities Futures Act), StoneX Financial Pte. Ltd. accepts legal responsibility to such persons for the contents of the report only to the extent required by law. Singapore recipients should contact StoneX Financial Pte. Ltd. at 6826 9988 for matters arising from, or in connection with the report.
In the case of all other recipients of this report, to the extent permitted by applicable laws and regulations neither StoneX Financial Pte. Ltd. nor its associated companies will be responsible or liable for any loss or damage incurred arising out of, or in connection with, any use of the information contained in this report and all such liability is hereby expressly disclaimed. No representation or warranty is made, express or implied, that the content of this report is complete or accurate.
StoneX Financial Pte. Ltd. is not under any obligation to update this report.
Trading CFDs carries a high level of risk that may not be suitable for some investors. Consider your investment objectives, level of experience, financial resources, risk appetite and other relevant circumstances carefully. The possibility exists that you could lose some or all of your investments, including your initial deposits. If in doubt, please seek independent expert advice. Visit www.forex.com/en-sg/terms-and-policies for the complete Risk Disclosure Statement.