



EURUSD and Gold Slide Ahead of FOMC Minutes
EURUSD and gold are sliding ahead of the FOMC minutes, as the DXY reclaims strength above the 97 mark, keeping key levels in focus to assess the sustainability of these pullbacks.
Share this:

Key Events
• FOMC minutes loom following stronger NFP data and softer CPI readings, supporting the DXY above 97
• Market risk sentiment remains cautious amid AI turbulence, geopolitical uncertainty, and expectations of prolonged rate holds
• The dollar’s hold near 97 pressured EURUSD below 1.1850 and gold back toward the 4,900 zone
CME fed watch tool

Despite moderating U.S. inflation and stronger-than-expected labor data, market odds for a March rate cut remain low. According to the CME FedWatch Tool, expectations for rate cuts begin to increase toward June 2026.
Recent CPI data showed inflation continuing to ease toward the Federal Reserve’s 2% target, with CPI m/m at 0.2% and CPI y/y at 2.4%. Meanwhile, January NFP surprised to the upside, with payrolls rising by 130,000 and unemployment edging down to 4.3%. This combination reinforces expectations that policymakers may keep rates elevated for longer.

This positioning has supported the DXY above its long-term 18-year support zone at 95–96, pushing it back toward 97. As a result, EURUSD slipped below the 1.1850 area, while gold retreated toward 4,900, placing key technical levels under scrutiny to confirm whether these moves are temporary pullbacks or the start of deeper corrections.
Technical Analysis: Quantifying Uncertainty
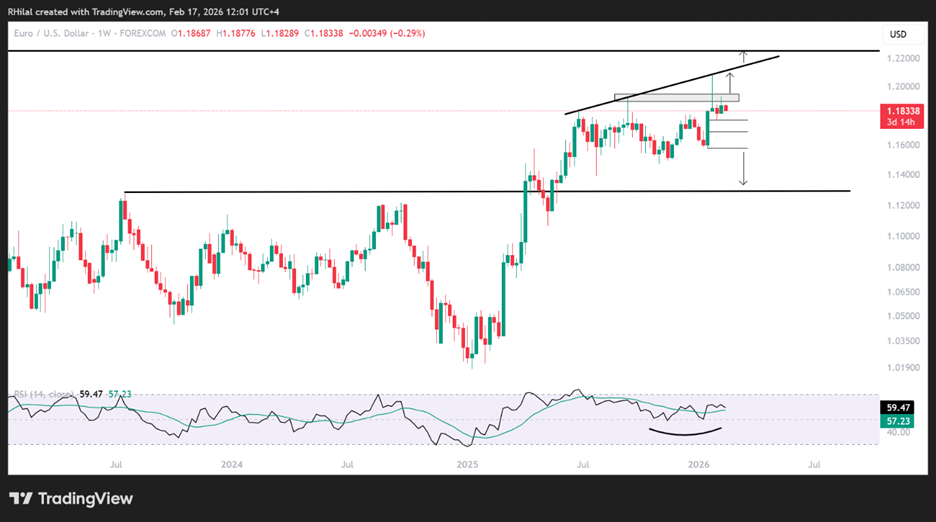
EURUSD Outlook: Weekly Time Frame – Log Scale
Source: Trading view
On the weekly chart, EURUSD is facing resistance connecting consecutive higher highs since June 2025, capping gains below the key 1.1950 zone. A daily or weekly close above this level is required to reassert bullish bias toward 1.20, before potentially extending toward the 2022 and 2018 highs near 1.23 and 1.25 respectively.
That outlines the bullish scenario. However, recent price action is turning lower, with downside risks building. A break below 1.1760, which represents the 0.618 retracement of the 2026 advance, could open the door to deeper drawdowns toward:
• 1.1680
• 1.1580
The 1.1580 level becomes pivotal. A hold there could revive bullish momentum. Failure to stabilize may expose the 1.12–1.11 zone, a scenario in which renewed dollar strength takes control.
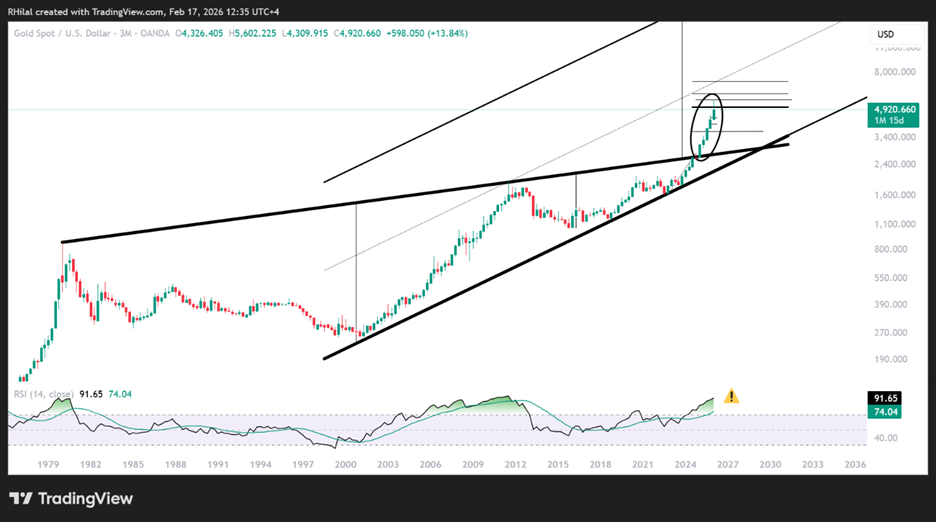
Gold Outlook: 3 Month Time Frame – Log Scale
Source: Trading view
The 3-month time frame is used to place the broader trend into perspective. The uptrend between November 2024 and January 2026 represents a breakout beyond the bounds of a multi-decade consolidation that had been in place since 1980.
This structure was discussed in my previous article Gold, Silver Outlook: Key Levels vs Volatility Risks and video Gold Prices Flash 1980s Signal as CPI Shock Tests Bull Run. The next chart is the weekly chart, where key levels are pointed out for the shorter term.
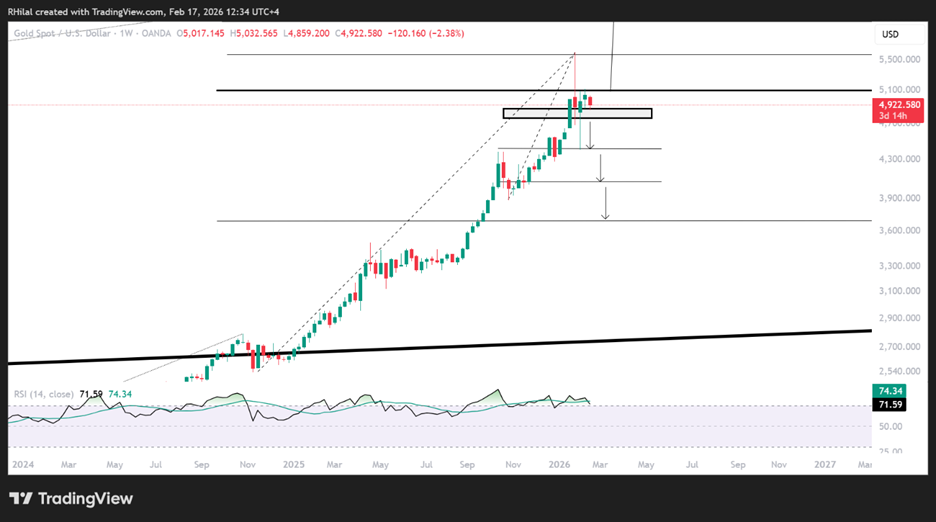
Gold Outlook: Weekly Time Frame – Log Scale
Source: Trading view
On the weekly chart, the Fibonacci retracement tool is applied to measure the potential drawdown of the move extending from the November 2024 lows to the January 2026 highs. The following levels stand out:
- 4,400 – 0.382 retracement, already respected as a support and dip-buying zone.
- 4,060–4,000 – 0.5 retracement and a major psychological barrier.
- 3,700 – 0.618 retracement, a critical level for potential trend reversal. Failure to hold here could extend losses toward the upper bound of the multi-year consolidation near 3,200, and possibly 2,900.
Written by Razan Hilal, CMT
Follow on X: @Rh_waves


Open an account in minutes
Experience award-winning platforms with fast and secure execution, and enjoy tight spreads from 0.5 pts on FX and 0.3 pts on indices.
Economic calendar
Web Trader platform
Our sophisticated web-based platform is packed with features.
Related articles
Gold Breaks Down on Descending Triangle, Sets Up $4k Test
Gold started last week with a strong sell-off but from that move a bounce developed. Bulls could not hold on through the weekly close, however, and the bearish structure remains in-place for XAU/USD.

USD/JPY weekly outlook: Quarter turn scrambles rates regime
USD/JPY’s tight relationship with front-end US rates broke down sharply last week, but quarter-turn flows and positioning suggest the disconnect may prove temporary.


Gold Update: XAU/USD Remains Under Pressure Even After the NFP Report
As the trading week comes to an end, weakness around gold price action remains evident in the short term. This can be seen in the performance of the past two sessions, where the metal has declined by approximately 0.3%. Although the move has not been particularly aggressive, it highlights that buying pressure continues to struggle to regain control of the market.

This report is intended for general circulation only. It should not be construed as a recommendation, or an offer (or solicitation of an offer) to buy or sell any financial products. The information provided does not take into account your specific investment objectives, financial situation or particular needs. Before you act on any recommendation that may be contained in this report, independent advice ought to be sought from a financial adviser regarding the suitability of the investment product, taking into account your specific investment objectives, financial situation or particular needs.
StoneX Financial Pte. Ltd., may distribute reports produced by its respective foreign entities or affiliates within the StoneX group of companies or third parties pursuant to an arrangement under Regulation 32C of the Financial Advisers Regulations. Where the report is distributed to a person in Singapore who is not an accredited investor, expert investor or an institutional investor (as defined in the Securities Futures Act), StoneX Financial Pte. Ltd. accepts legal responsibility to such persons for the contents of the report only to the extent required by law. Singapore recipients should contact StoneX Financial Pte. Ltd. at 6826 9988 for matters arising from, or in connection with the report.
In the case of all other recipients of this report, to the extent permitted by applicable laws and regulations neither StoneX Financial Pte. Ltd. nor its associated companies will be responsible or liable for any loss or damage incurred arising out of, or in connection with, any use of the information contained in this report and all such liability is hereby expressly disclaimed. No representation or warranty is made, express or implied, that the content of this report is complete or accurate.
StoneX Financial Pte. Ltd. is not under any obligation to update this report.
Trading CFDs carries a high level of risk that may not be suitable for some investors. Consider your investment objectives, level of experience, financial resources, risk appetite and other relevant circumstances carefully. The possibility exists that you could lose some or all of your investments, including your initial deposits. If in doubt, please seek independent expert advice. Visit www.forex.com/en-sg/terms-and-policies for the complete Risk Disclosure Statement.