







EUR/USD, GBP/USD, Gold, USD/JPY: US Dollar Price Action Setups
The US Dollar has put in a massive move in October but finally some resistance has appeared, allowing for a bit of strategy. The next week and a day are massive with inflation and employment data, followed by the election and another FOMC rate decision.
Share this:

US Dollar Talking Points:
- The US Dollar has put in another test of resistance at 104.50 and has yet to break through. There is a series of higher-lows remaining, and bulls did technically set a fresh higher-high earlier this morning so there’s no sign yet of the trend relenting.
- The next week and change is highly important for DXY dynamics, with Core PCE on Thursday and Non-farm Payrolls on Friday. Then the US Presidential Election next Tuesday followed by the Fed on Wednesday.
- At this point markets are still highly-expecting rate cuts at each of the Fed’s next two meetings along with three more in 2025. The data to finish this week will likely have pull on that. For USD-strength scenarios I still favor EUR/USD and in the webinar, I looked at possible lower-high resistance. For larger DXY pullbacks, however, I like GBP/USD and there’s an ascending triangle formation there with resistance at 1.3000.
The next week and a day are going to be busy for macro traders and the US Dollar is showing signs of stall after a massive move developed in October. I spent much of September tracking the grinding of the bearish trend in DXY and that flipped quickly as the door opened into Q4. And now there’s shorter-term signs of the opposite happening at resistance with the 104.50 level continuing to hold bulls at bay in DXY.
But the slate ahead is the type that can drive trends and we’ll get the Fed’s ‘preferred inflation gauge’ on Thursday morning in the form of Core PCE, followed by labor data which has been very important to the Fed of late, with Friday’s Non-farm Payrolls. The Presidential Election next Tuesday can similarly carry some sway and that’s followed on Wednesday by the FOMC rate decision.
At this point the Fed is expected to cut next Wednesday. But, if we get a strong showing in Core PCE and NFP, that could further bring to question that expectation which could drive additional USD-strength, particularly as the ECB is expected to continue softening rates.
In DXY there’s a short-term ascending triangle at-play. I’m tracking supports at 104-104.07 and then around the 200-day moving average at 103.82. Below that, prior support shows between a couple of Fibonacci levels at 103.32-103.46.
US Dollar Four-Hour Chart
 Chart prepared by James Stanley; data derived from Tradingview
Longer-term, RSI on the daily remains in overbought territory and in the webinar, I talked about the typical nature of turns. Stalling at a big spot is a big first step and that’s so far happened, but as looked at above, buyers still retain control given the shorter-term formation. If we do press-higher, that opens the door for possible ‘capitulation high’ scenarios, like what I was looking at in EUR/USD in late-September.
For resistance, 104.80 is the next spot overhead and the 105.00 level looms large above that.
US Dollar Daily Price Chart
 Chart prepared by James Stanley; data derived from Tradingview
EUR/USD
In last Tuesday’s webinar I looked at a confluent spot of support at 1.0765. At the time, the sell-off was continuing to bleed-lower but that spot on the chart represented some confluence with a bullish trendline drawn from last year’s low.
That spot came into play on Wednesday and led to a bounce.
Sellers went back to work this morning but the trendline was back in-play, and at this point, another short-term bounce has developed. As I said in the webinar, I wouldn’t necessarily get excited about reversals here yet, but this does put focus on lower-high resistance potential, similar to what had already shown at the 1.0805-1.0811 area. That zone was in-play this morning and it’s back in the picture as of this writing.
I’m tracking next resistance at 1.0825 and then the 1.0862-1.0872 zone.
EUR/USD Two-Hour Price Chart
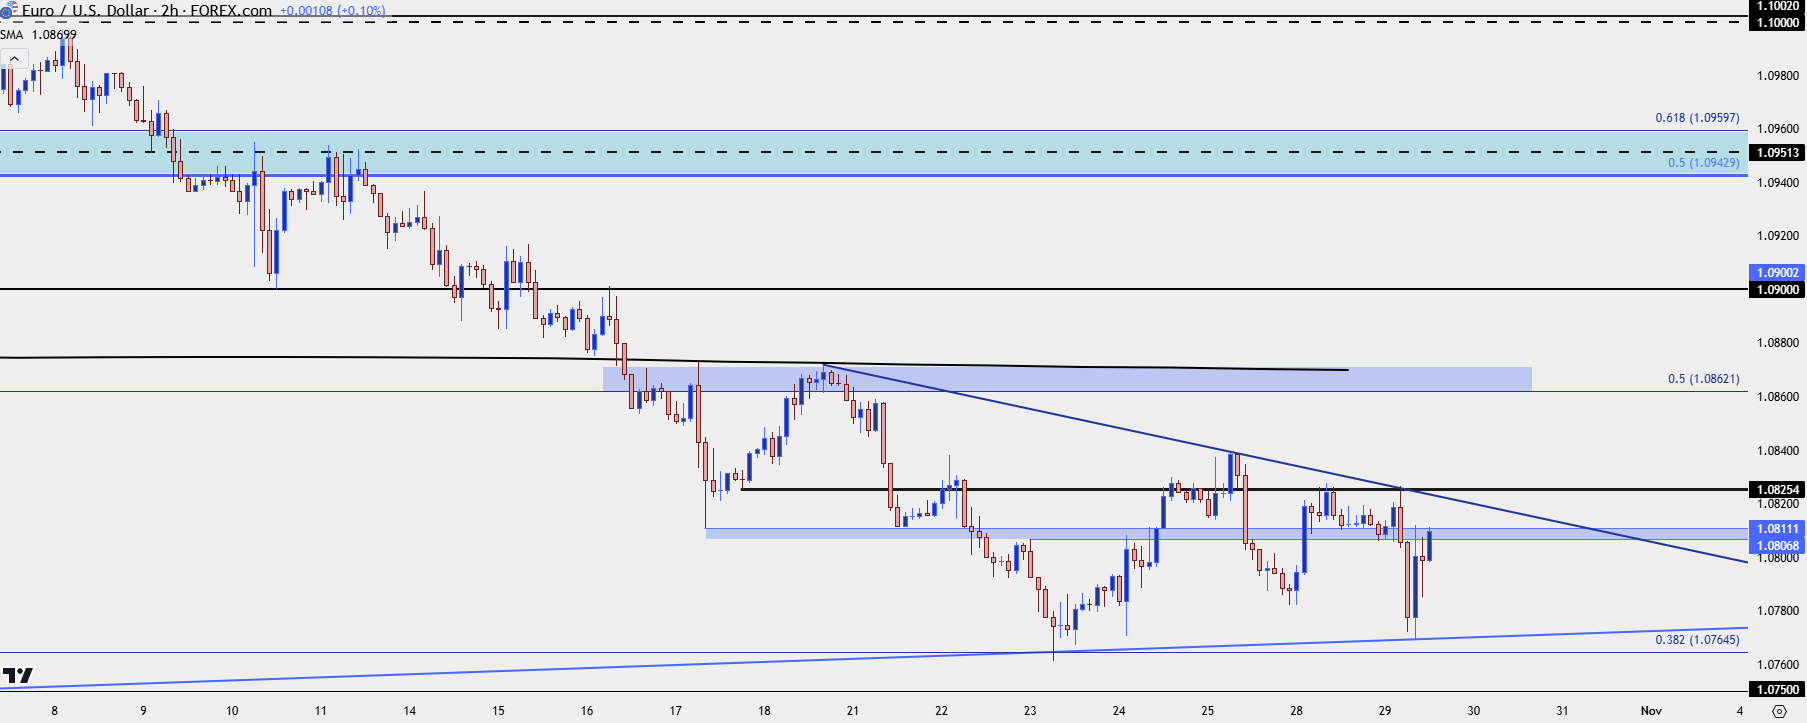 Chart prepared by James Stanley, EUR/USD on Tradingview
GBP/USD
If we do see a deeper drawdown in the USD bullish trend, GBP/USD has my attention. At the time of the webinar price was holding resistance at the 1.3000 psychological level and an ascending triangle had formed. I went over a couple of scenarios during the webinar, and this remains a more attractive venue for USD-weakness scenarios, in my opinion.
At this point, I’m tracking next resistance around 1.3025 and then 1.3070 before the 1.3100-1.3162 zone comes back into the picture.
GBP/USD Four-Hour Price Chart
 Chart prepared by James Stanley, GBP/USD on Tradingview
USD/JPY
USD/JPY still feels a bit like a wild card to me. I have difficulty getting excited about the fundamental argument behind the long side of the pair given how many rate cuts are expected in the US through the end of next year. That can change, of course, but the data releases on Thursday and Friday will be a big part of that.
Nonetheless, the price action can’t be argued as it’s been higher-highs and higher-lows. Although I think there may be cleaner backdrops elsewhere, such as the GBP/JPY or perhaps even EUR/JPY setups I wrote about yesterday.
At this point, the 153.40 Fibonacci level has held resistance in USD/JPY, and the 151.95 prior swing is support potential, and a hold there could constitute a higher-low above the 200-dma support test last week.
USD/JPY Daily Chart
 Chart prepared by James Stanley, USD/JPY on Tradingview
GBP/JPY
GBP/JPY has been particularly clean of late, to my eyes.
I wrote about a breakout setup in the pair in the weekly forecast a couple weeks ago, as the pair was holding an ascending triangle with resistance right at a key Fibonacci level. The pair is now more than 400 pips beyond that resistance, making a fast run at the 200-handle.
I updated the setup yesterday, looking at higher-low support at a key historical level of 198.08 and that has so far played, with a higher-low leading into this morning’s bounce.
GBP/JPY Four-Hour Chart
 Chart prepared by James Stanley, GBP/JPY on Tradingview
Gold
I spent quite a long time in the webinar talking about gold. As long as the Fed continues to push the rate cut narrative, even in light of strong US data, I think there’s still argument for bullish scenarios in gold.
The most recent digestion rectified in September with a strong breakout after the ECB rate cut and expectations remain for the Fed to cut again next week, gold bulls haven’t exactly backed off of the bid.
Chasing, however, could still be problematic and this morning showed growing acceptance of 2750 as there was multiple iterations of support from the two and four-hour chart. The question now is whether prior resistance at 2758 can hold a higher-low, thereby keeping the door open for another push and a test of the big figure at 2800.
Gold Two-Hour Price Chart
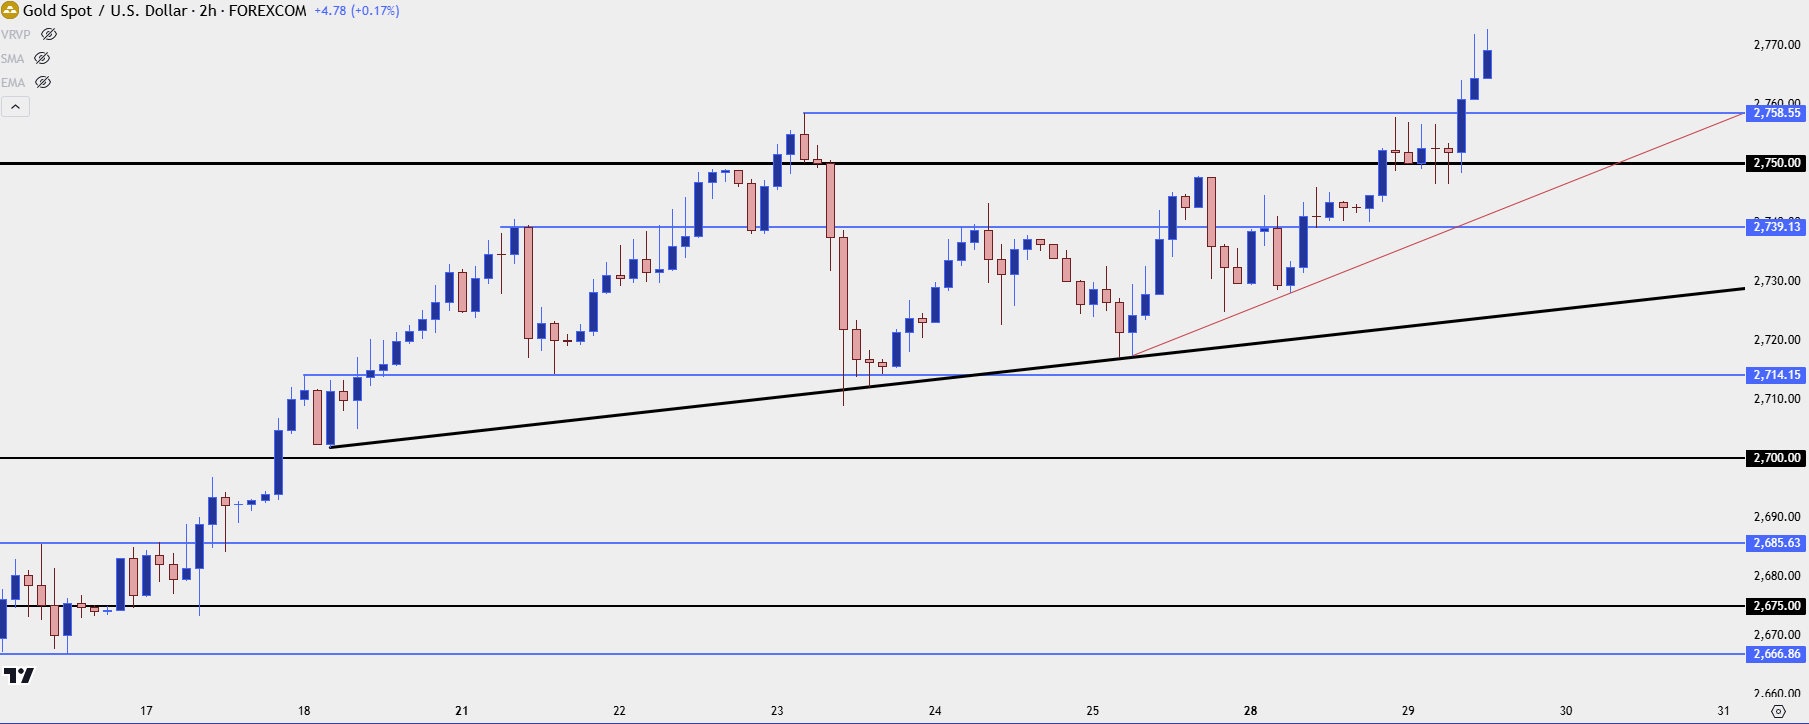 Chart prepared by James Stanley; data derived from Tradingview
--- written by James Stanley, Senior Strategist
US Dollar Talking Points:
- The US Dollar has put in another test of resistance at 104.50 and has yet to break through. There is a series of higher-lows remaining, and bulls did technically set a fresh higher-high earlier this morning so there’s no sign yet of the trend relenting.
- The next week and change is highly important for DXY dynamics, with Core PCE on Thursday and Non-farm Payrolls on Friday. Then the US Presidential Election next Tuesday followed by the Fed on Wednesday.
- At this point markets are still highly-expecting rate cuts at each of the Fed’s next two meetings along with three more in 2025. The data to finish this week will likely have pull on that. For USD-strength scenarios I still favor EUR/USD and in the webinar, I looked at possible lower-high resistance. For larger DXY pullbacks, however, I like GBP/USD and there’s an ascending triangle formation there with resistance at 1.3000.
The next week and a day are going to be busy for macro traders and the US Dollar is showing signs of stall after a massive move developed in October. I spent much of September tracking the grinding of the bearish trend in DXY and that flipped quickly as the door opened into Q4. And now there’s shorter-term signs of the opposite happening at resistance with the 104.50 level continuing to hold bulls at bay in DXY.
But the slate ahead is the type that can drive trends and we’ll get the Fed’s ‘preferred inflation gauge’ on Thursday morning in the form of Core PCE, followed by labor data which has been very important to the Fed of late, with Friday’s Non-farm Payrolls. The Presidential Election next Tuesday can similarly carry some sway and that’s followed on Wednesday by the FOMC rate decision.
At this point the Fed is expected to cut next Wednesday. But, if we get a strong showing in Core PCE and NFP, that could further bring to question that expectation which could drive additional USD-strength, particularly as the ECB is expected to continue softening rates.
In DXY there’s a short-term ascending triangle at-play. I’m tracking supports at 104-104.07 and then around the 200-day moving average at 103.82. Below that, prior support shows between a couple of Fibonacci levels at 103.32-103.46.
US Dollar Four-Hour Chart
Longer-term, RSI on the daily remains in overbought territory and in the webinar, I talked about the typical nature of turns. Stalling at a big spot is a big first step and that’s so far happened, but as looked at above, buyers still retain control given the shorter-term formation. If we do press-higher, that opens the door for possible ‘capitulation high’ scenarios, like what I was looking at in EUR/USD in late-September.
For resistance, 104.80 is the next spot overhead and the 105.00 level looms large above that.
US Dollar Daily Price Chart
EUR/USD
In last Tuesday’s webinar I looked at a confluent spot of support at 1.0765. At the time, the sell-off was continuing to bleed-lower but that spot on the chart represented some confluence with a bullish trendline drawn from last year’s low.
That spot came into play on Wednesday and led to a bounce.
Sellers went back to work this morning but the trendline was back in-play, and at this point, another short-term bounce has developed. As I said in the webinar, I wouldn’t necessarily get excited about reversals here yet, but this does put focus on lower-high resistance potential, similar to what had already shown at the 1.0805-1.0811 area. That zone was in-play this morning and it’s back in the picture as of this writing.
I’m tracking next resistance at 1.0825 and then the 1.0862-1.0872 zone.
EUR/USD Two-Hour Price Chart
GBP/USD
If we do see a deeper drawdown in the USD bullish trend, GBP/USD has my attention. At the time of the webinar price was holding resistance at the 1.3000 psychological level and an ascending triangle had formed. I went over a couple of scenarios during the webinar, and this remains a more attractive venue for USD-weakness scenarios, in my opinion.
At this point, I’m tracking next resistance around 1.3025 and then 1.3070 before the 1.3100-1.3162 zone comes back into the picture.
GBP/USD Four-Hour Price Chart
USD/JPY
USD/JPY still feels a bit like a wild card to me. I have difficulty getting excited about the fundamental argument behind the long side of the pair given how many rate cuts are expected in the US through the end of next year. That can change, of course, but the data releases on Thursday and Friday will be a big part of that.
Nonetheless, the price action can’t be argued as it’s been higher-highs and higher-lows. Although I think there may be cleaner backdrops elsewhere, such as the GBP/JPY or perhaps even EUR/JPY setups I wrote about yesterday.
At this point, the 153.40 Fibonacci level has held resistance in USD/JPY, and the 151.95 prior swing is support potential, and a hold there could constitute a higher-low above the 200-dma support test last week.
USD/JPY Daily Chart
GBP/JPY
GBP/JPY has been particularly clean of late, to my eyes.
I wrote about a breakout setup in the pair in the weekly forecast a couple weeks ago, as the pair was holding an ascending triangle with resistance right at a key Fibonacci level. The pair is now more than 400 pips beyond that resistance, making a fast run at the 200-handle.
I updated the setup yesterday, looking at higher-low support at a key historical level of 198.08 and that has so far played, with a higher-low leading into this morning’s bounce.
GBP/JPY Four-Hour Chart
Gold
I spent quite a long time in the webinar talking about gold. As long as the Fed continues to push the rate cut narrative, even in light of strong US data, I think there’s still argument for bullish scenarios in gold.
The most recent digestion rectified in September with a strong breakout after the ECB rate cut and expectations remain for the Fed to cut again next week, gold bulls haven’t exactly backed off of the bid.
Chasing, however, could still be problematic and this morning showed growing acceptance of 2750 as there was multiple iterations of support from the two and four-hour chart. The question now is whether prior resistance at 2758 can hold a higher-low, thereby keeping the door open for another push and a test of the big figure at 2800.
Gold Two-Hour Price Chart
--- written by James Stanley, Senior Strategist


Open an account in minutes
Experience award-winning platforms with fast and secure execution, and enjoy tight spreads from 0.5 pts on FX and 0.3 pts on indices.
Economic calendar
Web Trader platform
Our sophisticated web-based platform is packed with features.
Related articles
Gold Breaks Down on Descending Triangle, Sets Up $4k Test
Gold started last week with a strong sell-off but from that move a bounce developed. Bulls could not hold on through the weekly close, however, and the bearish structure remains in-place for XAU/USD.

USD/JPY weekly outlook: Quarter turn scrambles rates regime
USD/JPY’s tight relationship with front-end US rates broke down sharply last week, but quarter-turn flows and positioning suggest the disconnect may prove temporary.


Gold Update: XAU/USD Remains Under Pressure Even After the NFP Report
As the trading week comes to an end, weakness around gold price action remains evident in the short term. This can be seen in the performance of the past two sessions, where the metal has declined by approximately 0.3%. Although the move has not been particularly aggressive, it highlights that buying pressure continues to struggle to regain control of the market.

This report is intended for general circulation only. It should not be construed as a recommendation, or an offer (or solicitation of an offer) to buy or sell any financial products. The information provided does not take into account your specific investment objectives, financial situation or particular needs. Before you act on any recommendation that may be contained in this report, independent advice ought to be sought from a financial adviser regarding the suitability of the investment product, taking into account your specific investment objectives, financial situation or particular needs.
StoneX Financial Pte. Ltd., may distribute reports produced by its respective foreign entities or affiliates within the StoneX group of companies or third parties pursuant to an arrangement under Regulation 32C of the Financial Advisers Regulations. Where the report is distributed to a person in Singapore who is not an accredited investor, expert investor or an institutional investor (as defined in the Securities Futures Act), StoneX Financial Pte. Ltd. accepts legal responsibility to such persons for the contents of the report only to the extent required by law. Singapore recipients should contact StoneX Financial Pte. Ltd. at 6826 9988 for matters arising from, or in connection with the report.
In the case of all other recipients of this report, to the extent permitted by applicable laws and regulations neither StoneX Financial Pte. Ltd. nor its associated companies will be responsible or liable for any loss or damage incurred arising out of, or in connection with, any use of the information contained in this report and all such liability is hereby expressly disclaimed. No representation or warranty is made, express or implied, that the content of this report is complete or accurate.
StoneX Financial Pte. Ltd. is not under any obligation to update this report.
Trading CFDs carries a high level of risk that may not be suitable for some investors. Consider your investment objectives, level of experience, financial resources, risk appetite and other relevant circumstances carefully. The possibility exists that you could lose some or all of your investments, including your initial deposits. If in doubt, please seek independent expert advice. Visit www.forex.com/en-sg/terms-and-policies for the complete Risk Disclosure Statement.