










FOMC leaves rates unchanged as GME and TSLA steal the show DXY USDJPY
If stocks move lower, one should look for USD/JPY to continue higher
Share this:

The FOMC left rates unchanged today and noted that monetary policy moving forward is not only going to depend on the coronavirus, but also the vaccine rollout. However, the real story of the day was in stocks. Traders continued to punish GME shorts and TSLA missed expectations by 23 cents ($0.08 vs $1.03 estimated).
S&P 500 futures broke lower out of an ascending wedge and was met with the 200 Day Average at 3706.50. The next level of support on the daily timeframe is the green trendline, which dates to January 2018 near 3650.
Source: Tradingview, CME, City Index
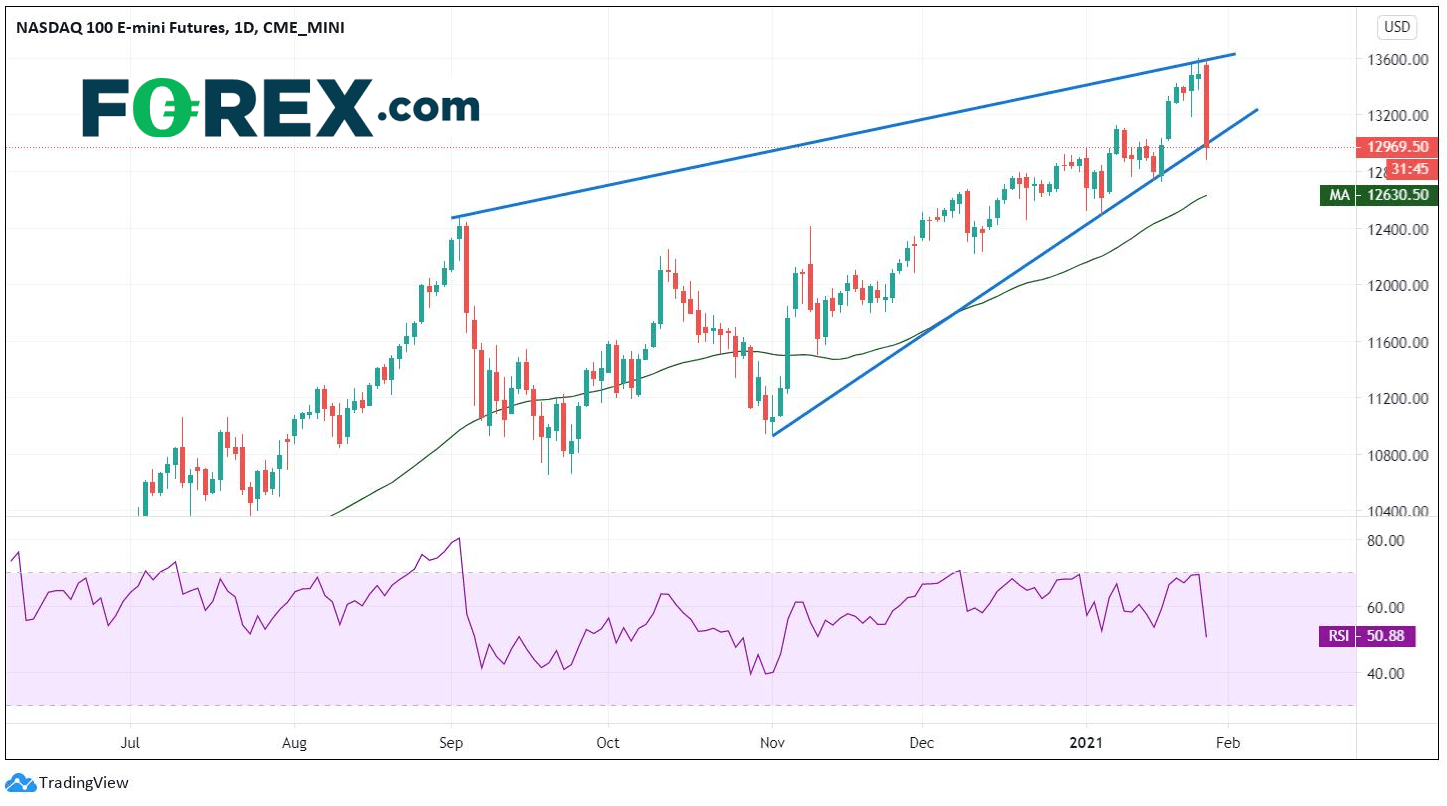
Meanwhile, the Nasdaq 100 futures are down nearly 4% after Telsa earnings, halting at the bottom trendline of an ascending wedge of its own. If price breaks lower, the 200 Day Moving Average crosses at 12630.
Source: Tradingview, CME, City Index
As stocks moved lower, the US Dollar moved higher, closing the day up near up nearly 0.5% and just below its own 200 Day Moving Average near 90.65.
Source: Tradingview, City Index
One of the currency pairs that was largely affected by the selloff in stocks was USD/JPY. The pair is trading in a bullish pattern on shorter timeframes, within a bullish pattern on the daily timeframe.
USD/JPY has been moving lower since 2015. On a daily timeframe the pair has been moving lower in a descending wedge , with a test of the bottom trendline and current low on January 6th near 102.59. After bouncing off a trendline, one would expect price to try and test the other trendline, currently near 104.45. This level now acts as next resistance and confluences with the 61.8% Fibonacci retracement level from the highs of November 11th, 2020 to the January 6th lows, as well as, the prior highs from January 11th.
Source: Tradingview, City Index
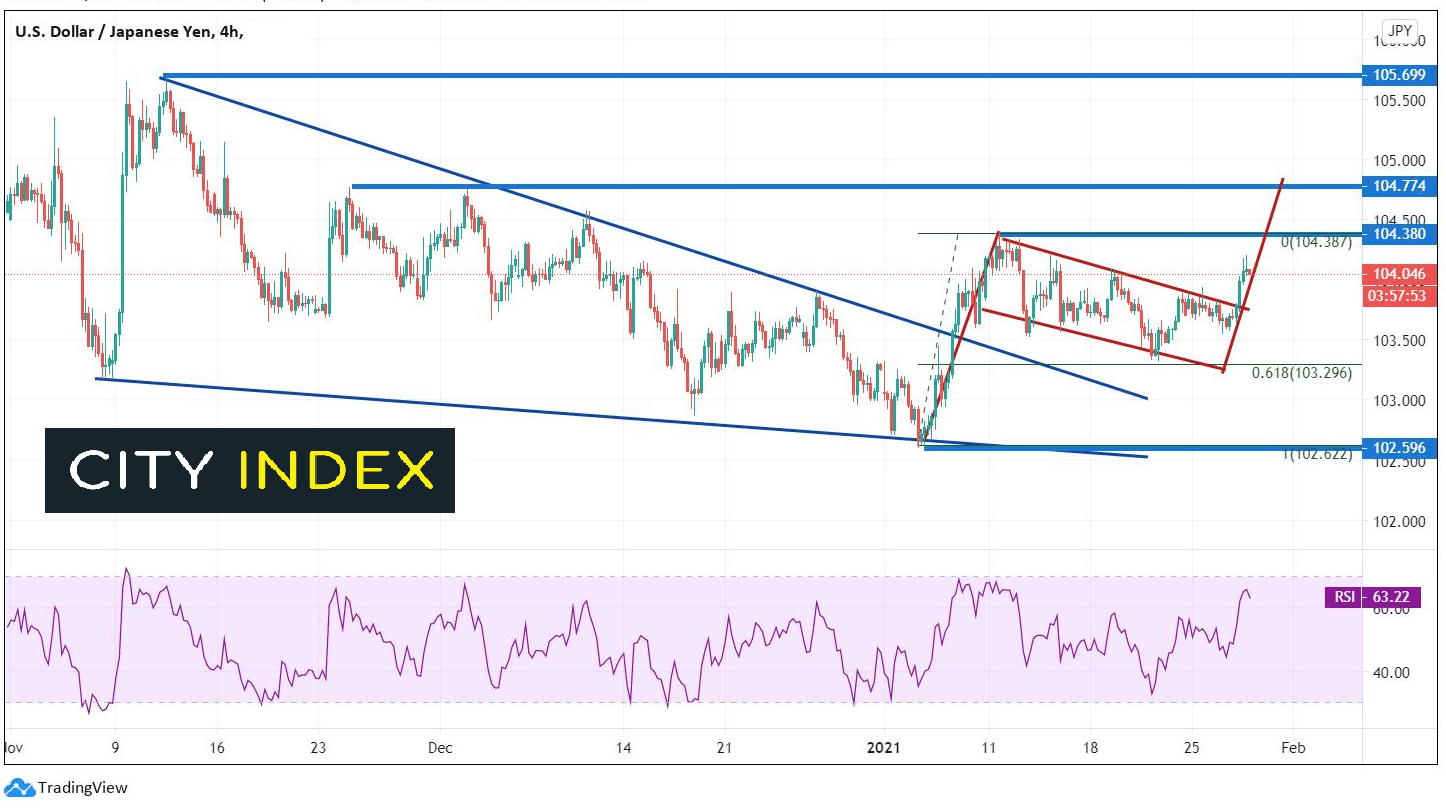
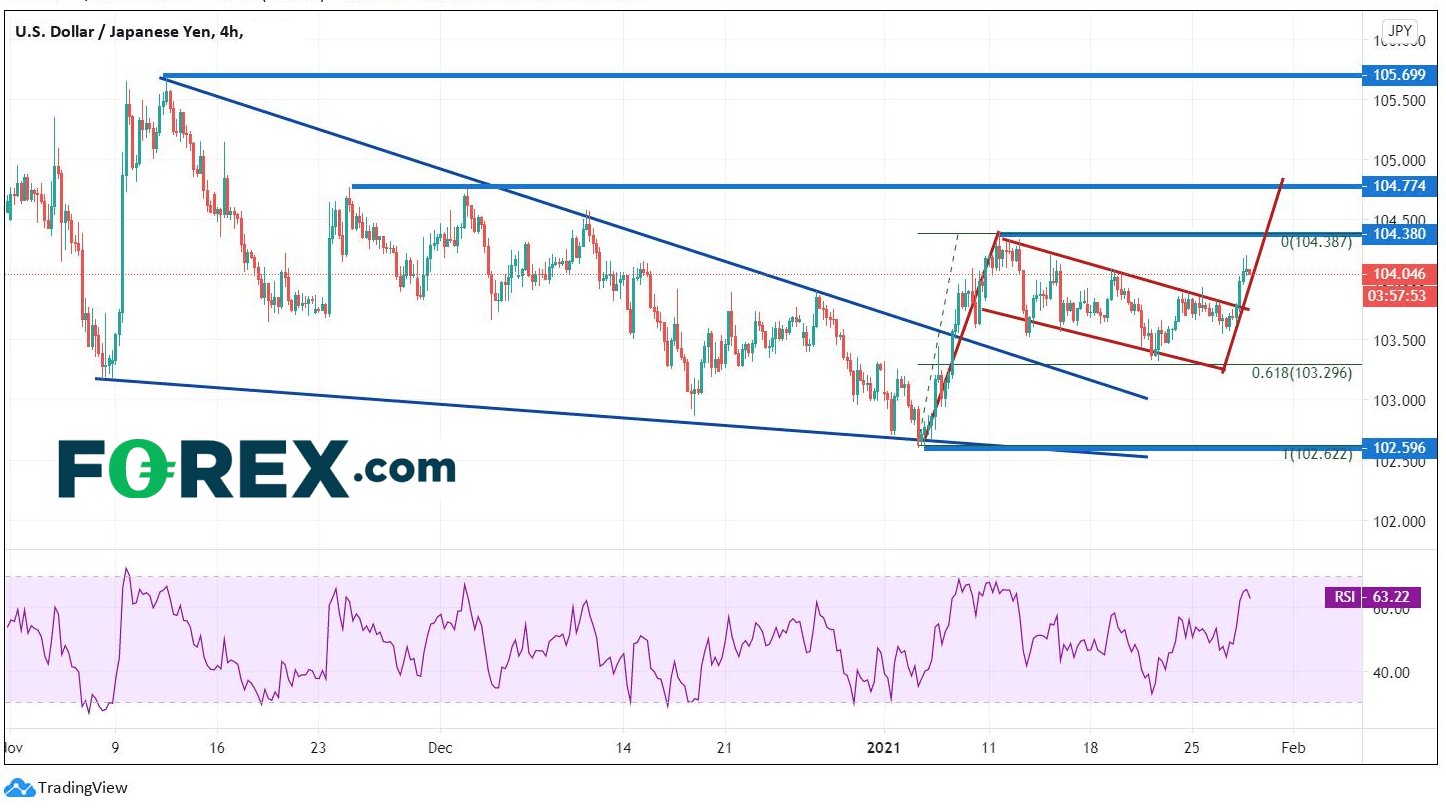
Additionally, on a 240-minute timeframe, USD/JPY price has formed a smaller descending wedge. After breaking out of the wedge, price action formed a flag pattern, and today, price broke out. The target for a flag pattern is the length of the flagpole added to the breakout point of the flag, or near 104.80, which confluences with horizontal resistance. If price is to get there, it must first break through the 104.45 area. Support is at the top trendline of the flag near 103.75, then the flag lows at 103.35, which confluences with the 61.8% Fibonacci retracement from the January 6th lows to the January 11th highs.
Source: Tradingview, City Index
If stock market indices continue to move lower over the next couple of days, traders should expect the US Dollar to move higher. USD/JPY beats to its own drum at times, however since the pandemic, it has been moving with the DXY. Therefore, if stocks do move lower, one should look for USD/JPY to continue higher towards the flag target near 104.80, then the descending wedge target on the 240-minute timeframe near 105.70!
PS – check out the Volatility S&P 500 Index today (VIX), up 61.5% on the day!
Source: Tradingview, City Index
Learn more about forex trading opportunities.
Learn more about index trading opportunitiesThe FOMC left rates unchanged today and noted that monetary policy moving forward is not only going to depend on the coronavirus, but also the vaccine rollout. However, the real story of the day was in stocks. Traders continued to punish GME shorts and TSLA missed expectations by 23 cents ($0.08 vs $1.03 estimated).
S&P 500 futures broke lower out of an ascending wedge and was met with the 200 Day Average at 3706.50. The next level of support on the daily timeframe is the green trendline, which dates to January 2018 near 3650.
Source: Tradingview, CME, FOREX.com
Meanwhile, the Nasdaq 100 futures are down nearly 4% after Telsa earnings, halting at the bottom trendline of an ascending wedge of its own. If price breaks lower, the 200 Day Moving Average crosses at 12630.
Source: Tradingview, CME, FOREX.com
As stocks moved lower, the US Dollar moved higher, closing the day up near up nearly 0.5% and just below its own 200 Day Moving Average near 90.65.
Source: Tradingview, FOREX.com
One of the currency pairs that was largely affected by the selloff in stocks was USD/JPY. The pair is trading in a bullish pattern on shorter timeframes, within a bullish pattern on the daily timeframe.
USD/JPY has been moving lower since 2015. On a daily timeframe the pair has been moving lower in a descending wedge , with a test of the bottom trendline and current low on January 6th near 102.59. After bouncing off a trendline, one would expect price to try and test the other trendline, currently near 104.45. This level now acts as next resistance and confluences with the 61.8% Fibonacci retracement level from the highs of November 11th, 2020 to the January 6th lows, as well as, the prior highs from January 11th.
Source: Tradingview, FOREX.com
Additionally, on a 240-minute timeframe, USD/JPY price has formed a smaller descending wedge. After breaking out of the wedge, price action formed a flag pattern, and today, price broke out. The target for a flag pattern is the length of the flagpole added to the breakout point of the flag, or near 104.80, which confluences with horizontal resistance. If price is to get there, it must first break through the 104.45 area. Support is at the top trendline of the flag near 103.75, then the flag lows at 103.35, which confluences with the 61.8% Fibonacci retracement from the January 6th lows to the January 11th highs.
Source: Tradingview, FOREX.com
If stock market indices continue to move lower over the next couple of days, traders should expect the US Dollar to move higher. USD/JPY beats to its own drum at times, however since the pandemic, it has been moving with the DXY. Therefore, if stocks do move lower, one should look for USD/JPY to continue higher towards the flag target near 104.80, then the descending wedge target on the 240-minute timeframe near 105.70!
PS – check out the Volatility S&P 500 Index today (VIX), up 61.5% on the day!
Source: Tradingview, FOREX.com
Learn more about forex trading opportunities.

Open an account in minutes
Experience award-winning platforms with fast and secure execution, and enjoy tight spreads from 0.5 pts on FX and 0.3 pts on indices.
Economic calendar
Web Trader platform
Our sophisticated web-based platform is packed with features.
Related articles

USD/JPY weekly outlook: Quarter turn scrambles rates regime
USD/JPY’s tight relationship with front-end US rates broke down sharply last week, but quarter-turn flows and positioning suggest the disconnect may prove temporary.


USD/CAD forecast: rally could accelerate above June highs at 1.4250
USD/CAD recovered quickly after weaker US jobs data, keeping the bullish trend in focus. A move above the June highs could accelerate the rally as inflation keeps the Fed under pressure.


USD Sets Fresh Yearly High as EUR/USD Drops Dramatically, USD/JPY Stable
Well, it was a week of USD strength that wasn’t entirely pushed by USD/JPY, as a strong sell-off in EUR/USD has pushed the major pair to its most oversold state in a decade.
This report is intended for general circulation only. It should not be construed as a recommendation, or an offer (or solicitation of an offer) to buy or sell any financial products. The information provided does not take into account your specific investment objectives, financial situation or particular needs. Before you act on any recommendation that may be contained in this report, independent advice ought to be sought from a financial adviser regarding the suitability of the investment product, taking into account your specific investment objectives, financial situation or particular needs.
StoneX Financial Pte. Ltd., may distribute reports produced by its respective foreign entities or affiliates within the StoneX group of companies or third parties pursuant to an arrangement under Regulation 32C of the Financial Advisers Regulations. Where the report is distributed to a person in Singapore who is not an accredited investor, expert investor or an institutional investor (as defined in the Securities Futures Act), StoneX Financial Pte. Ltd. accepts legal responsibility to such persons for the contents of the report only to the extent required by law. Singapore recipients should contact StoneX Financial Pte. Ltd. at 6826 9988 for matters arising from, or in connection with the report.
In the case of all other recipients of this report, to the extent permitted by applicable laws and regulations neither StoneX Financial Pte. Ltd. nor its associated companies will be responsible or liable for any loss or damage incurred arising out of, or in connection with, any use of the information contained in this report and all such liability is hereby expressly disclaimed. No representation or warranty is made, express or implied, that the content of this report is complete or accurate.
StoneX Financial Pte. Ltd. is not under any obligation to update this report.
Trading CFDs carries a high level of risk that may not be suitable for some investors. Consider your investment objectives, level of experience, financial resources, risk appetite and other relevant circumstances carefully. The possibility exists that you could lose some or all of your investments, including your initial deposits. If in doubt, please seek independent expert advice. Visit www.forex.com/en-sg/terms-and-policies for the complete Risk Disclosure Statement.