









GBP/USD analysis: Flash PMIs are mixed ahead of US, EU, UK reports
GBP/USD has fallen to a technical juncture ahead of flash PMI reports from the UK, EU and US.
Share this:

Flash PMIs are an investors favourite when it comes to economic indicators, as they can provide a forward look at GDP figures, alongside underlying trends within employment and inflationary figures. And that makes it an ideal tool for investors to place bets on future monetary policy action of a country or region’s respective central bank.
The table above shows the final composite data of the past 12 months for the US, Europe, Germany, France, Australia and Japan. All of which release reports today. We can see that the respective economies were contracting in Q4 2023 and potentially peaked around April to June this year. The fact that they are now all trending lower plays into the theme of central bank easing for the Fed, ECB and BOE.
The RBA is the exception as they’re cash rate remains relatively low, and employment and inflation remains too firm to justify cuts. It is therefore interesting to see that Australia’s composite PMI contracted at a slower pace and is in fact close to expansion (above 50).
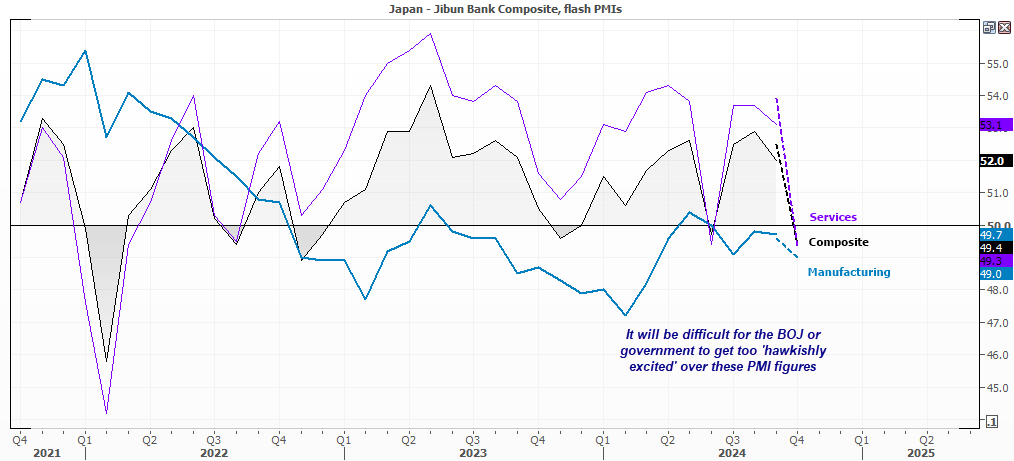
Japan’s data was weak overall, which once again makes it difficult to construct a hawkish case for the BOJ.
Australia’s economy shrank at a slower pace with a composite PMI reading of 49.8, (49.6 previously).
- Services PMI increased to a 2-month high of 50.6
- New orders increased, hiring rose at fastest pace in five months, price pressures eased
- Manufacturing PMI sank to a 53-month low of 46.7
- Weak demand for goods, employment, and purchasers were lower
Japan’s economy slipped back into contraction, with a composite PMI of 49.4.
- Services slipped below 50 to 49.3, down from 53.1 prior
- Manufacturing contracted at a faster pace of 49.5, compared with 49.7 prior
- New orders, employment and outlook for both sectors was weaker (faster contraction for manufacturing, slower gorwth for services)
- Input and output prices for services was stronger
Attention now shifts to Europe, the UK and US. In that order. While we can see that the economies of the three main regions has slowed, consensus estimates have pencilled in a slight improvement overall for manufacturing and services. That means downside misses may be required to spark the more volatile reaction (and appease doves).
- Take note that data from France and Germany can provide a lead for the Euro Area figures, and potentially weigh on the euro if they miss by a wide enough margin on bets of a more dovish ECB.
- GBP/USD traders will want to see broad weakness across services and manufacturing, but in particular a more bearish reaction for GBP could be expected if we see ‘prices paid’ soften notably to justify more BOE cuts
- Attention then shifts to the US for their latest set of PMI, which I suspect has the greatest chance of surprising to the upside given data has generally outperformed in recent weeks
- Currency traders will want to see a divergence between the data sets to spark larger moves (a weak EU or UK report coupled with a stronger-than-expected US report would likely be bearish for GBP/USD and EUR/USD, for example)
GBP/USD technical analysis:
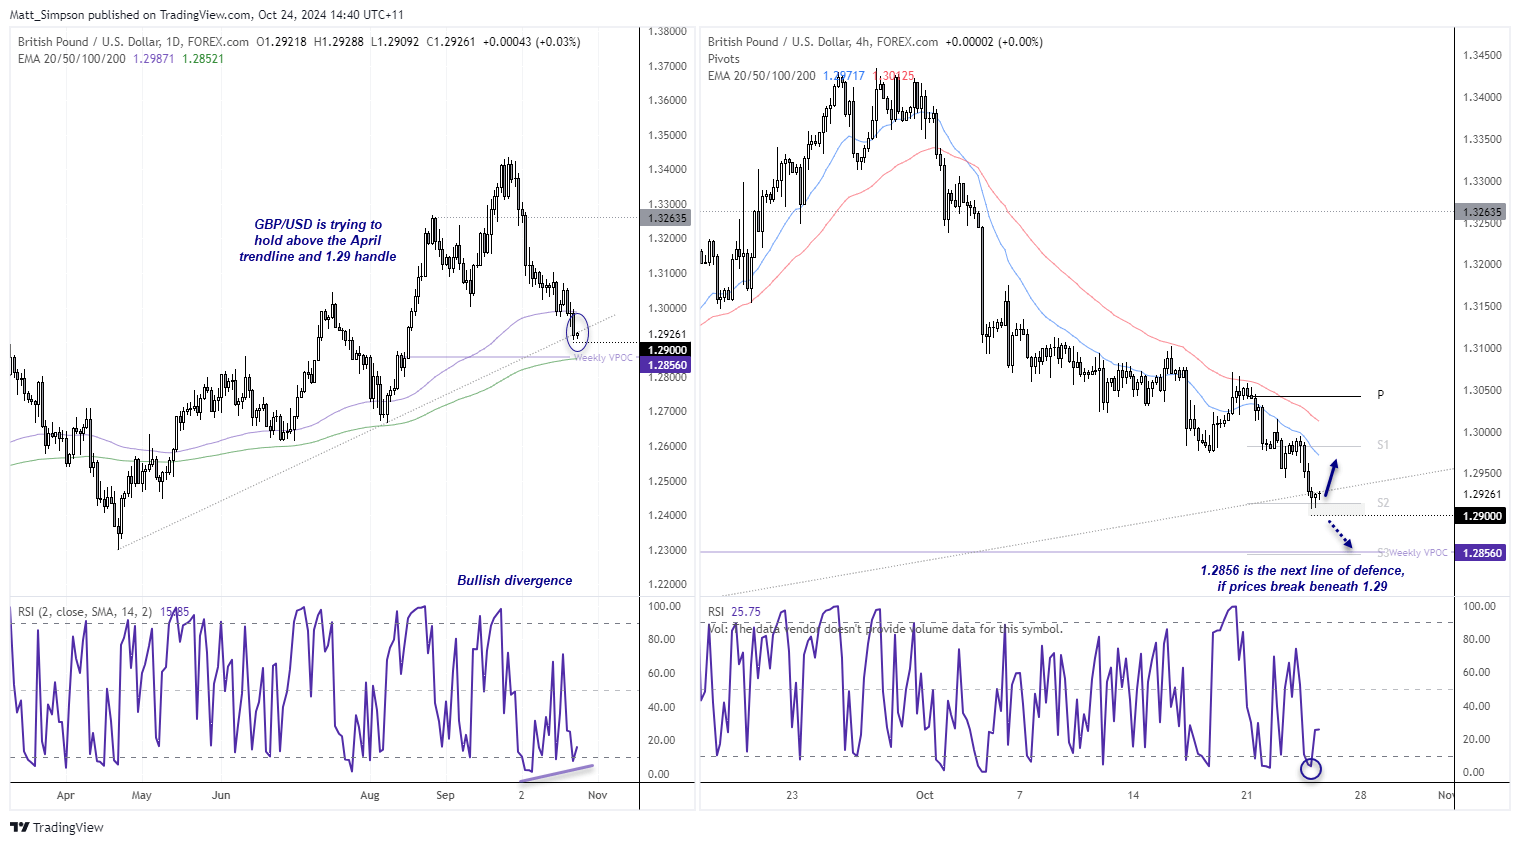
The British pound has fallen just under 4% over the past four weeks, and finds itself trapped between the 200-day and 100-day EMAs. While 1.30 gave way this week, prices are tyring to build a base above 1.29 ahead of today’s figures. A strong set of PMI figures could help lift it from its lows, although bears could return if this was then coupled with a strong(er) US PMI report.
Should prices break beneath 1.29, GBP/USD might find support around the historical weekly VPOC (volume point of control) at 1.2856. This bearish move is not exactly new, and with a bullish divergence forming on the daily RSI (2) and the 4-hour recently having reached oversold, perhaps a bounce is indeed due.
View the full economic calendar
View the full economic calendar
-- Written by Matt Simpson
Follow Matt on Twitter @cLeverEdge
How to trade with City Index
You can trade with City Index by following these four easy steps:
- Open an account, or log in if you’re already a customer
• Open an account in the UK
• Open an account in Australia
• Open an account in Singapore
- Search for the market you want to trade in our award-winning platform
- Choose your position and size, and your stop and limit levels
- Place the trade
Related tags:


Open an account in minutes
Experience award-winning platforms with fast and secure execution, and enjoy tight spreads from 0.5 pts on FX and 0.3 pts on indices.
Economic calendar
Web Trader platform
Our sophisticated web-based platform is packed with features.
Related articles
USD/JPY weekly outlook: Quarter turn scrambles rates regime
USD/JPY’s tight relationship with front-end US rates broke down sharply last week, but quarter-turn flows and positioning suggest the disconnect may prove temporary.

USD/CAD forecast: rally could accelerate above June highs at 1.4250
USD/CAD recovered quickly after weaker US jobs data, keeping the bullish trend in focus. A move above the June highs could accelerate the rally as inflation keeps the Fed under pressure.


USD Sets Fresh Yearly High as EUR/USD Drops Dramatically, USD/JPY Stable
Well, it was a week of USD strength that wasn’t entirely pushed by USD/JPY, as a strong sell-off in EUR/USD has pushed the major pair to its most oversold state in a decade.

This report is intended for general circulation only. It should not be construed as a recommendation, or an offer (or solicitation of an offer) to buy or sell any financial products. The information provided does not take into account your specific investment objectives, financial situation or particular needs. Before you act on any recommendation that may be contained in this report, independent advice ought to be sought from a financial adviser regarding the suitability of the investment product, taking into account your specific investment objectives, financial situation or particular needs.
StoneX Financial Pte. Ltd., may distribute reports produced by its respective foreign entities or affiliates within the StoneX group of companies or third parties pursuant to an arrangement under Regulation 32C of the Financial Advisers Regulations. Where the report is distributed to a person in Singapore who is not an accredited investor, expert investor or an institutional investor (as defined in the Securities Futures Act), StoneX Financial Pte. Ltd. accepts legal responsibility to such persons for the contents of the report only to the extent required by law. Singapore recipients should contact StoneX Financial Pte. Ltd. at 6826 9988 for matters arising from, or in connection with the report.
In the case of all other recipients of this report, to the extent permitted by applicable laws and regulations neither StoneX Financial Pte. Ltd. nor its associated companies will be responsible or liable for any loss or damage incurred arising out of, or in connection with, any use of the information contained in this report and all such liability is hereby expressly disclaimed. No representation or warranty is made, express or implied, that the content of this report is complete or accurate.
StoneX Financial Pte. Ltd. is not under any obligation to update this report.
Trading CFDs carries a high level of risk that may not be suitable for some investors. Consider your investment objectives, level of experience, financial resources, risk appetite and other relevant circumstances carefully. The possibility exists that you could lose some or all of your investments, including your initial deposits. If in doubt, please seek independent expert advice. Visit www.forex.com/en-sg/terms-and-policies for the complete Risk Disclosure Statement.